
The Workday Adaptive Planning 2020 R1 release provides deeper insights and a more streamlined reporting experience. This update focuses heavily on advanced data summarisation, sophisticated visualisation tools, and significant performance improvements.
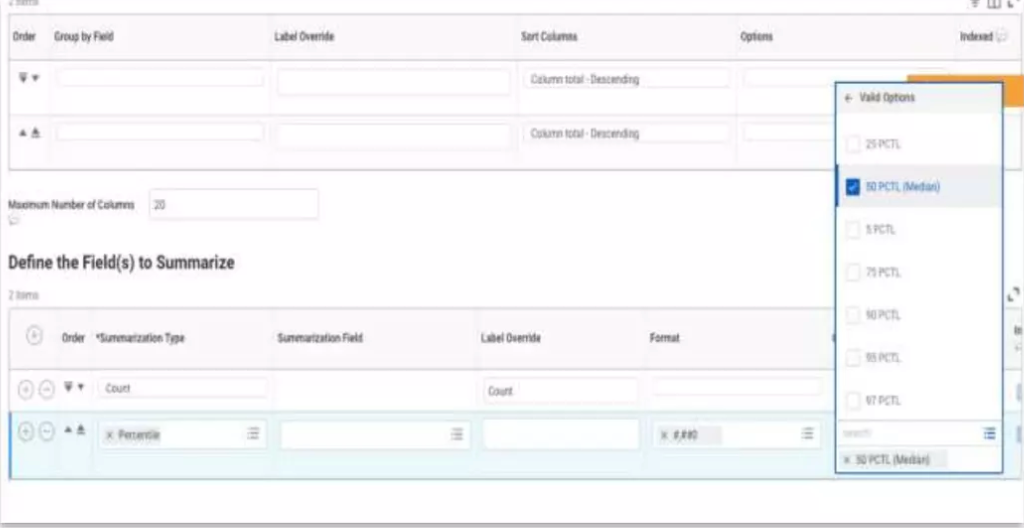
Percentile and median summarisation
A new summarisation type is now available for both existing and new custom reports. Users can now report on percentiles and medians directly within their Workday data.
Key benefits
This provides significantly more control over report design. Instead of relying on simple averages, finance leaders can gain deeper insights into data distributions, helping to identify outliers or trends that standard metrics might miss.
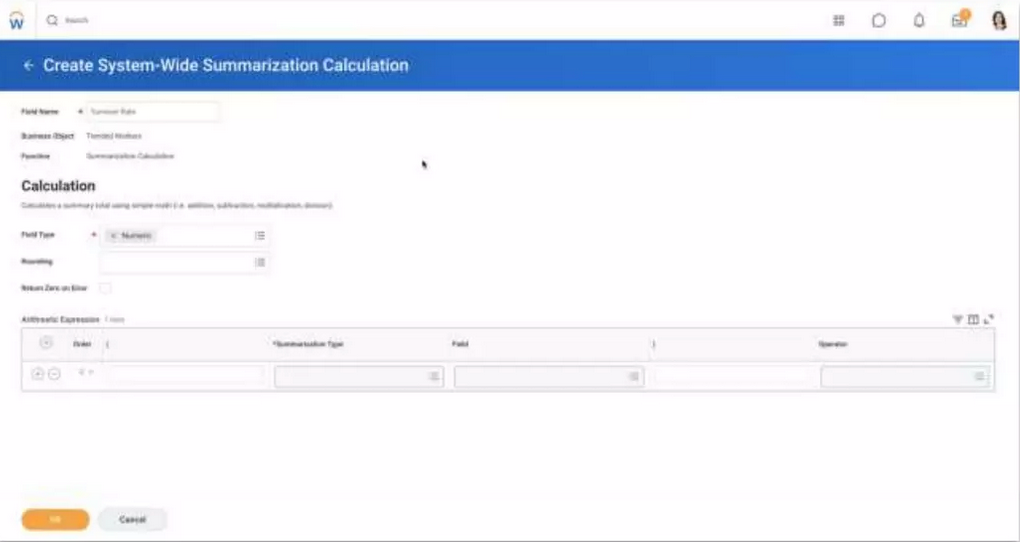
Global summarisation calculations
This feature allows you to create single definitions for key Human Capital Management (HCM) and financial metrics. Once defined, these calculations can be reused throughout your entire instance.
Key benefits
Global summarisations simplify your calculation inventory. By centralising these definitions, it becomes much easier to maintain your models and ensures consistency across all reports, reducing the risk of manual errors.
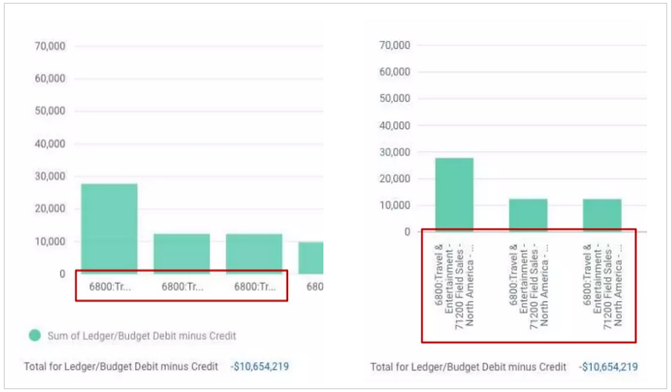
Dual axis and combination charts
Reporting capabilities have expanded with new chart types available for custom reports. Users can now utilise dual axes and combination charting to display multiple data series simultaneously.
Key benefits
These charts offer more control over visual design and allow for clearer insights via enhanced visualisation of data sets of varying scales. It makes complex data relationships much easier to interpret at a glance.
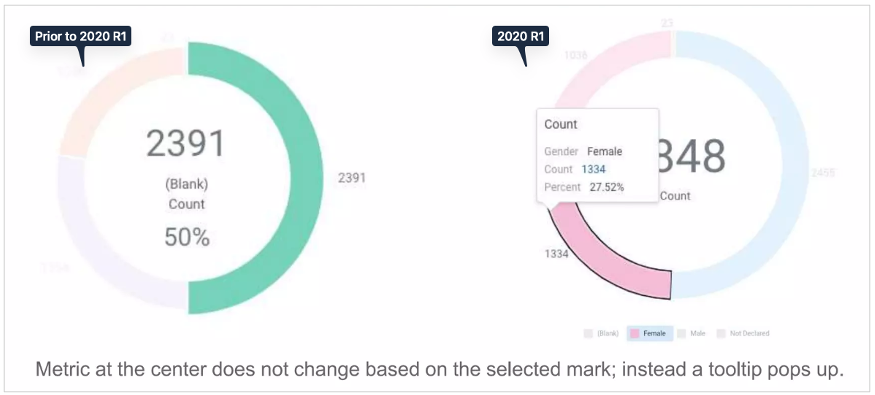
Charting enhancements
The user interface for charts has received a significant upgrade, including enhanced hover text response, improved zoom controls, and several run-time rendering enhancements.
Key benefits
These updates provide a smoother, more consistent interaction with your data. Beyond the immediate UX benefits, these enhancements lay the technical foundation for maintaining high performance even when visualising data at hyper-scales.
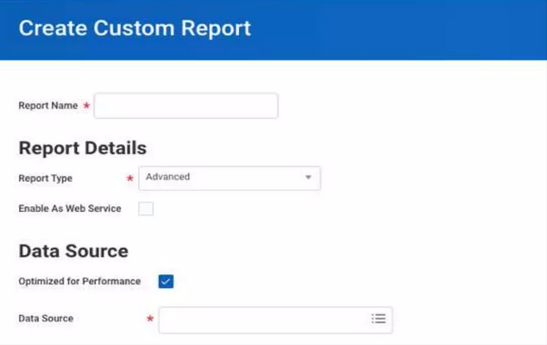
Performance enhancements
To ensure efficiency, all new custom reports are now set to “optimised for performance” by default. Additionally, users now have greater visibility into data source types, such as indexed data sources or Prism data sources.
Key benefits
This update creates essential guardrails for performance optimisation. By making data source selection more transparent, it is easier for users to understand how their reports are pulling data and ensure they are running as quickly as possible.
Want to learn more about how to leverage these features in your organisation? Reach out to the QMetrix team for support.
Connect with us and stay up to date with Workday Adaptive Planning news and releases: