The 2020R1 Release of Workday Adaptive Planning / Adaptive Insights included a revised dashboarding platform for Active Dashboards.
In our experience, dashboards are often considered an ‘afterthought’. A lot of time is spent on setting up the model and hierarchy structure, creating Profit and Loss, Board and Cash Flow reports, but little time is delegated to setting up informative and insightful dashboards.
However, investing some time on dashboards might be worth your while.
Watch the video or continue reading below.
What is Active Dashboards and how to use it
In previous releases, the planning and budgeting process were separate from the dashboarding functions. Once an update had been made from a planning perspective, users could then open their dashboard to review the impact of the change.
Whilst the impact of the change could still be recognised, it often meant users were moving back and forth between the budgeting tool and the dashboard multiple times.
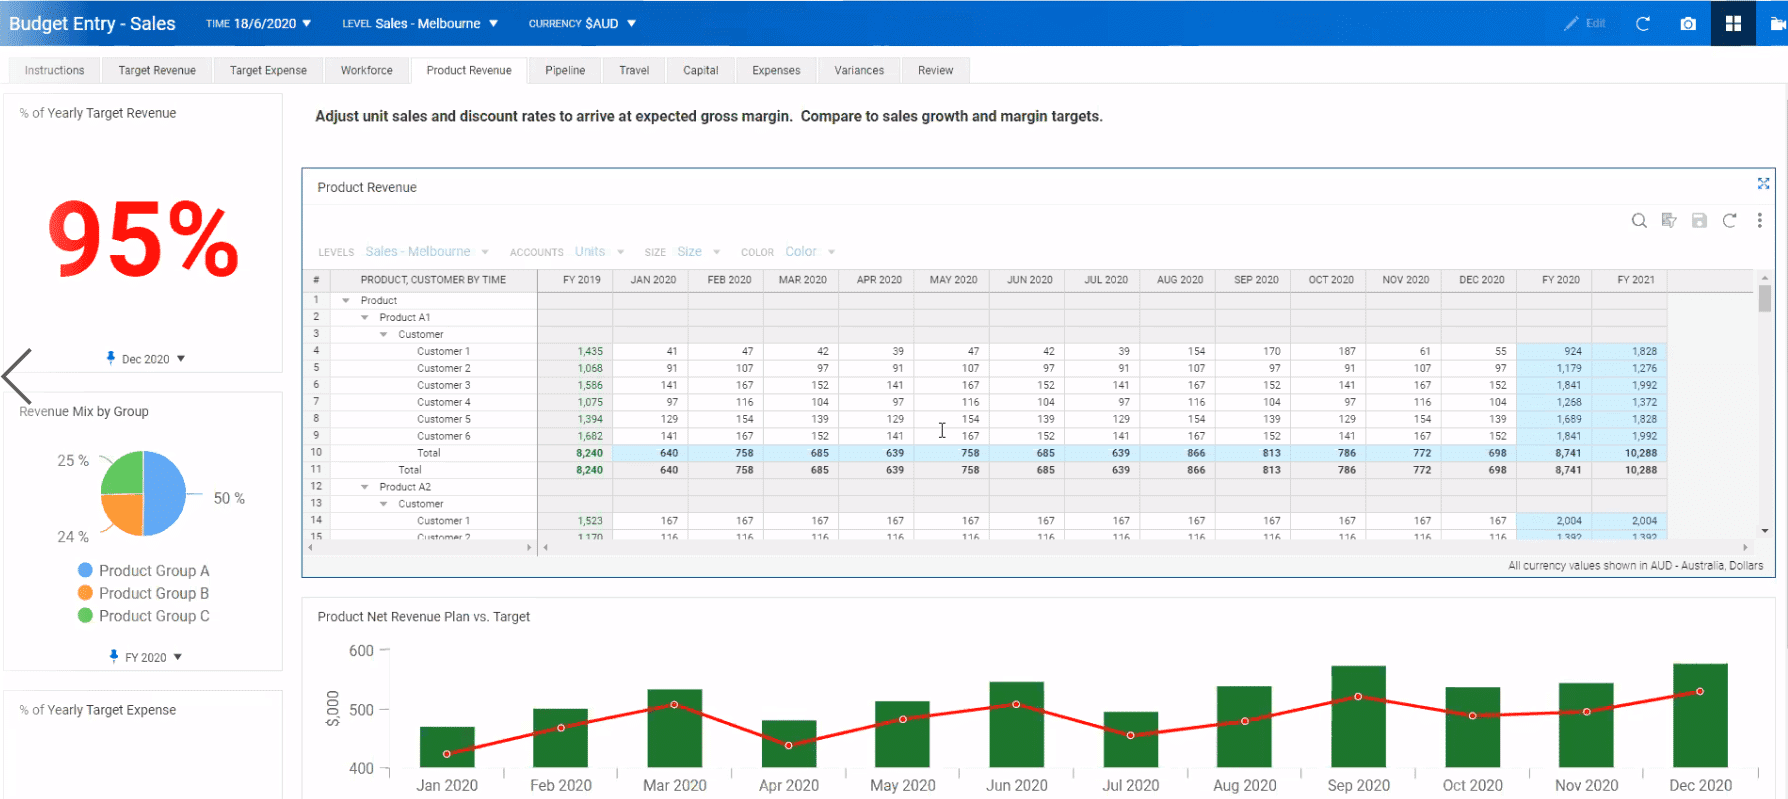
Active dashboards have streamlined this process with the inclusion of sheets as widgets on the dashboard. This allows the user to input, change, and adjust values in the sheet and automatically see the impact on the visualisations.

The dimensions on the sheet widget can also be changed to consolidate the view prior to making any adjustments. This allows the end user the flexibility to see their data from different perspectives. It also removes the need to build multiple dashboards to suit different requirements.

Multiple values can be adjusted at once by highlighting all required cells, right-click and adjust. The screenshot below demonstrates how to set a 30% increase to the highlighted cells.

After saving the changes made to the sheet, the visualisations will adjust and reflect the changes. Instead of having to switch between the adjustments screen and your dashboard, the entire view is consolidated into the one dashboard.
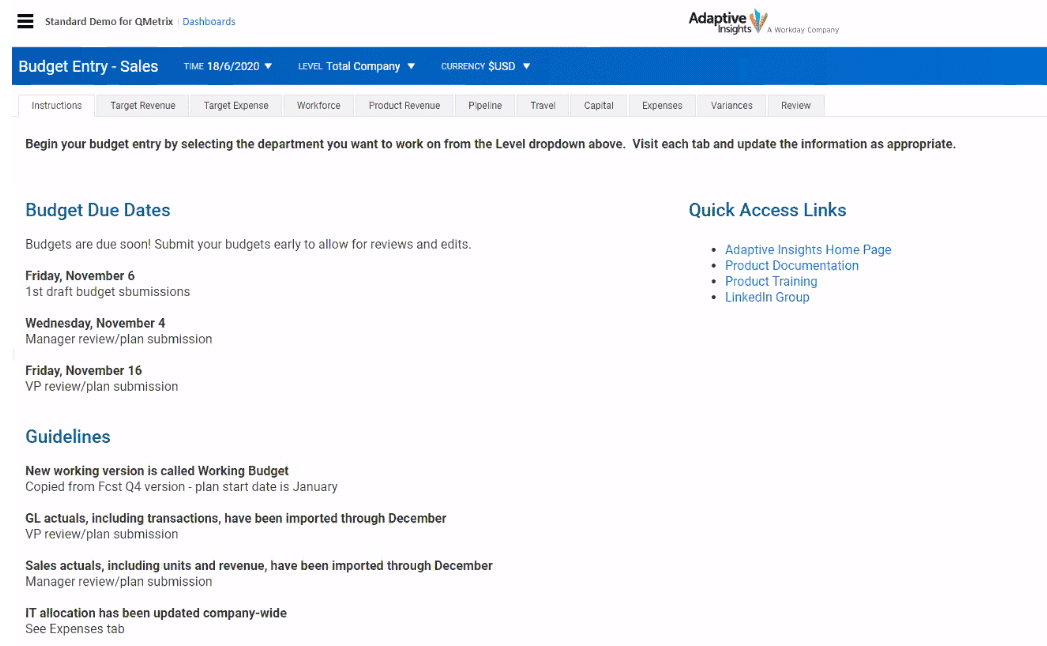
Additionally, text can be added to dashboards to help provide context and additional information. In the example below, the text feature has been utilised to provide step by step instructions to guide users through the dashboard.

Setting Dashboards as your home screen
Follow the instructions below to change your home screen to an existing dashboard.
- At the top right side of the home screen, select the user drop-down and settings.

- Change the Home page setting to Dashboards, and select the desired dashboard in the Perspective property. The Dashboard property allows you to set the specific page on the dashboard you would like to use as your homepage.

Check your Knowledge Centre to stay updated
Active Dashboards is just one of the features in the 2020R1 release of Workday Adaptive Planning / Adaptive Insights. To make the most of the technology, check the support pages in your Knowledge Centre for information on updates and releases.

Looking for more Workday Adaptive Planning / Adaptive Insights best practice tips?


