What is a Cognos Active Report?
A Cognos Active Report is essentially a standalone report that can be viewed offline disconnected from the network, but still contain all the interactivity of a live connected report including drill through and drill downs to detail. This allows your report consumers to receive for example, a highly interactive dashboard report via email, where they can open it up on the road at any time and be able to interrogate the information in any way as if they were connected to a live system.
The Active Report is a relatively new report output type introduced in IBM Cognos 10.1 (C10.1) where the actual output type is an Extensible Hypertext Markup Language (XHTML) file that can be downloaded and consumed on many different devices (laptops, tablets, mobiles etc.).
Advantages
As mentioned above, the 2 key features Active Reports provide is greater user interactivity with disconnected content. Traditionally, reports built in Cognos had to either be interactive HTML reports, accessed through an internet browser from the Cognos portal and executed upon connected data sources, or static report outputs such as PDF or Excel. The Active Report bridges the gap between these two types of reports by extracting the required data and pre-processing it into all possible variations and packaging it up for offline consumption.
Even though Active Reports are disconnected, they can be extended to include drill-throughs to live data as long as the user has access to Cognos connection, giving users access to offline and online content.
IBM references “speed of thought” when they talk about Active Report performance. While that may be a bit of a stretch, the response time to user interactions is almost instantaneous due to the pre-aggregated and pre-calculated nature of these reports.
Active reports are subject to all of the normal security available in Cognos, including bursting and report access. When the output is accessed outside of the Cognos solution, a password can be placed on the file so that only authorised people can view its content.
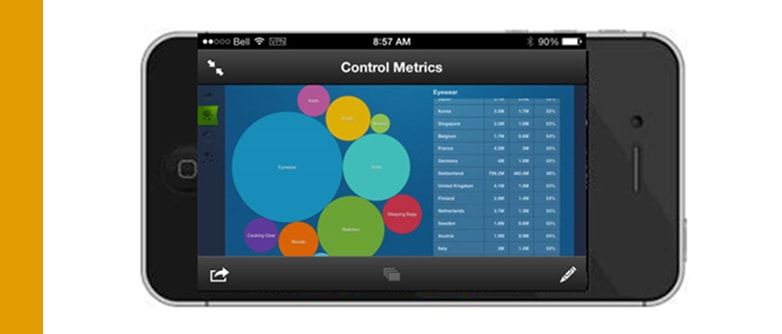
Active Reports are ideal for accessing on mobile devices such as mobiles and tablets.
Disadvantages
The execution time for Active Reports can sometimes be prohibitive. This is due to the fact that the reports extract all data required for all possible combinations of prompt selections and also have to pre-aggregate and calculate where possible. Some Active Reports can take hours to generate. There are techniques that can be followed to help minimise report execution times, but sometimes due to source system complexity and functionality requirements, execution times can still be excessive.
Prompt combinations need to be considered carefully. For example, if you have a crosstab that needs to be filtered by Product, Customer and Date as well as the ability to swap rows and columns, the possible combinations a user can select would probably number in the thousands, if not tens or hundreds of thousands. When the system is building the report, it has to generate the output for all of the combinations, which could result in long run times, large files and poor performance.
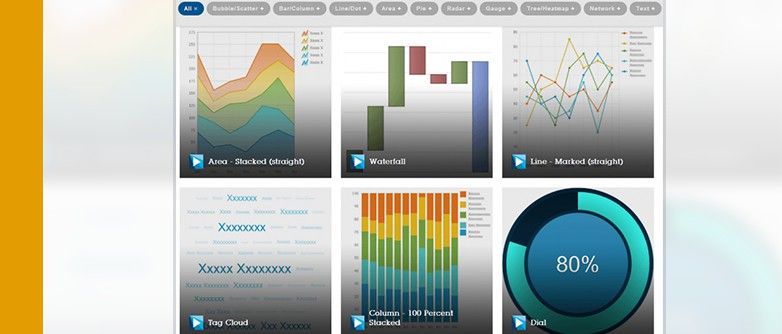
Having lots of charts can affect the performance of the reports as the chart image needs to be stored in the output file. The introduction of a new visualization engine had been a great solution for Active Reports and charting as they don’t require an image to be stored, but a dataset instead, which is rendered when the report is run.
The size of the XHTML file can significantly affect performance, generally speaking, the larger the file, the slower the report responds to user interactions and a lag can be seen. Again, there are techniques that can be used to try reduce the size of the file, but sometimes they do get quite large. As a general rule, once the file exceeds around 10MB performance starts to suffer, although it does depend on the reason why the file is large.
Printing is limited to browser printing or screen capture image printing. The output cannot be exported to something like PDF or Excel for additional printing options.
Use Cases
In our experience, the most common reason for implementing Active Reports is the performance of the source systems. As Active Reports extract the data and pre-process it, the performance of an AR compared to running against the source system is far superior. Interactions including filtering, sorting, view change, etc. occur instantaneously in most cases. Some larger Active Reports may show some lag, but it’s generally much faster than:
- Filling in prompts
- Submitting the report
- Waiting for the report to execute
- Waiting for the report to render
- Repeat when you want to change a prompt value.
The other main use case we find is, being disconnected, especially for those out on the road facing clients or suppliers. Sales people and logistics managers are able to take a device such as an iPad out on the road and discuss figures or performance with people in an interactive fashion without the need to be connected to the office.
There has been good adoption of these reports when delivering dashboards due to their visually appealing nature and superior performance.
Active reports are ideal for distribution to external customers as they provide an interactive experience for the users, but significantly reduce the risk and complexity of opening up the organisation to external parties directly accessing data.
Development Considerations
Our experience has been that the time to build Active Reports is longer than that of a traditional report. This is not because they are harder to build or more laborious, but generally because users try to fit more functionality into the report than they would a traditional report. There also has to be a switch in the developers mind from traditional report writing, almost to that of building an application. The developer has to plan out what the report will look like, where objects will be placed and how they will interact with each other. There is a shift from focussing on the query to focussing on the user interaction and experience.
The Verdict
It’s important to note that Active Reports are a complimentary or additional tool, not necessarily a replacement for HTML, PDFs or Excel reports. They have their place in the stack of available options and it’s a matter of making the decision as to which option best suits the required functionality.
Active reports have certainly assisted many of our clients who were facing performance issues or who needed to disconnect and take their reports with them on the road.
Additional Resources.
Now that Active Reports have been around for a few years there is plenty of content available online for techniques, tips and tricks.
- IBM maintains an excellent resource each release called the Active Report Cookbook. This is a comprehensive, easy to read resource that many developers reference on a regular basis.
- IBM, and others, have placed many “How To” videos on YouTube regarding Active Reports. These videos range from high level demo videos to detailed problem specific ones.
Stephen Arnott
Principal Consultant