Workday Adaptive Planning (formerly Adaptive Insights) is a cloud-based Corporate Performance Management solution that makes planning easy and empowers finance teams to better support the business and drive efficiencies.
Workday Adaptive Planning continues to improve the software through each release. It has maintained its position as a top performer on sites like Gartner, TrustRadius and G2 crowd for its features and high customer satisfaction rating.
Stay up to date with each Workday Adaptive Planning release as they are launched.
Our team of corporate performance management experts review each version to help Workday customers:
- Get a breakdown of the latest features and functionalities added
- See how the software has progressed
- Decide what can be implemented for your organisation
Read the latest Workday Adaptive Planning release notes below. Alternatively, select any version from the history in the table of contents:
Jump to other releases
Workday Adaptive Planning Release 2025 R1 – Review: March 2025
In case you missed it – some new Adaptive Planning features landed in March 2025. Don’t have time to read the full release notes? No sweat, we’ve got you covered. We’ve scoured the notes and identified the best features you’ll want to consider bringing into your instance!
Add Reports on Dashboards
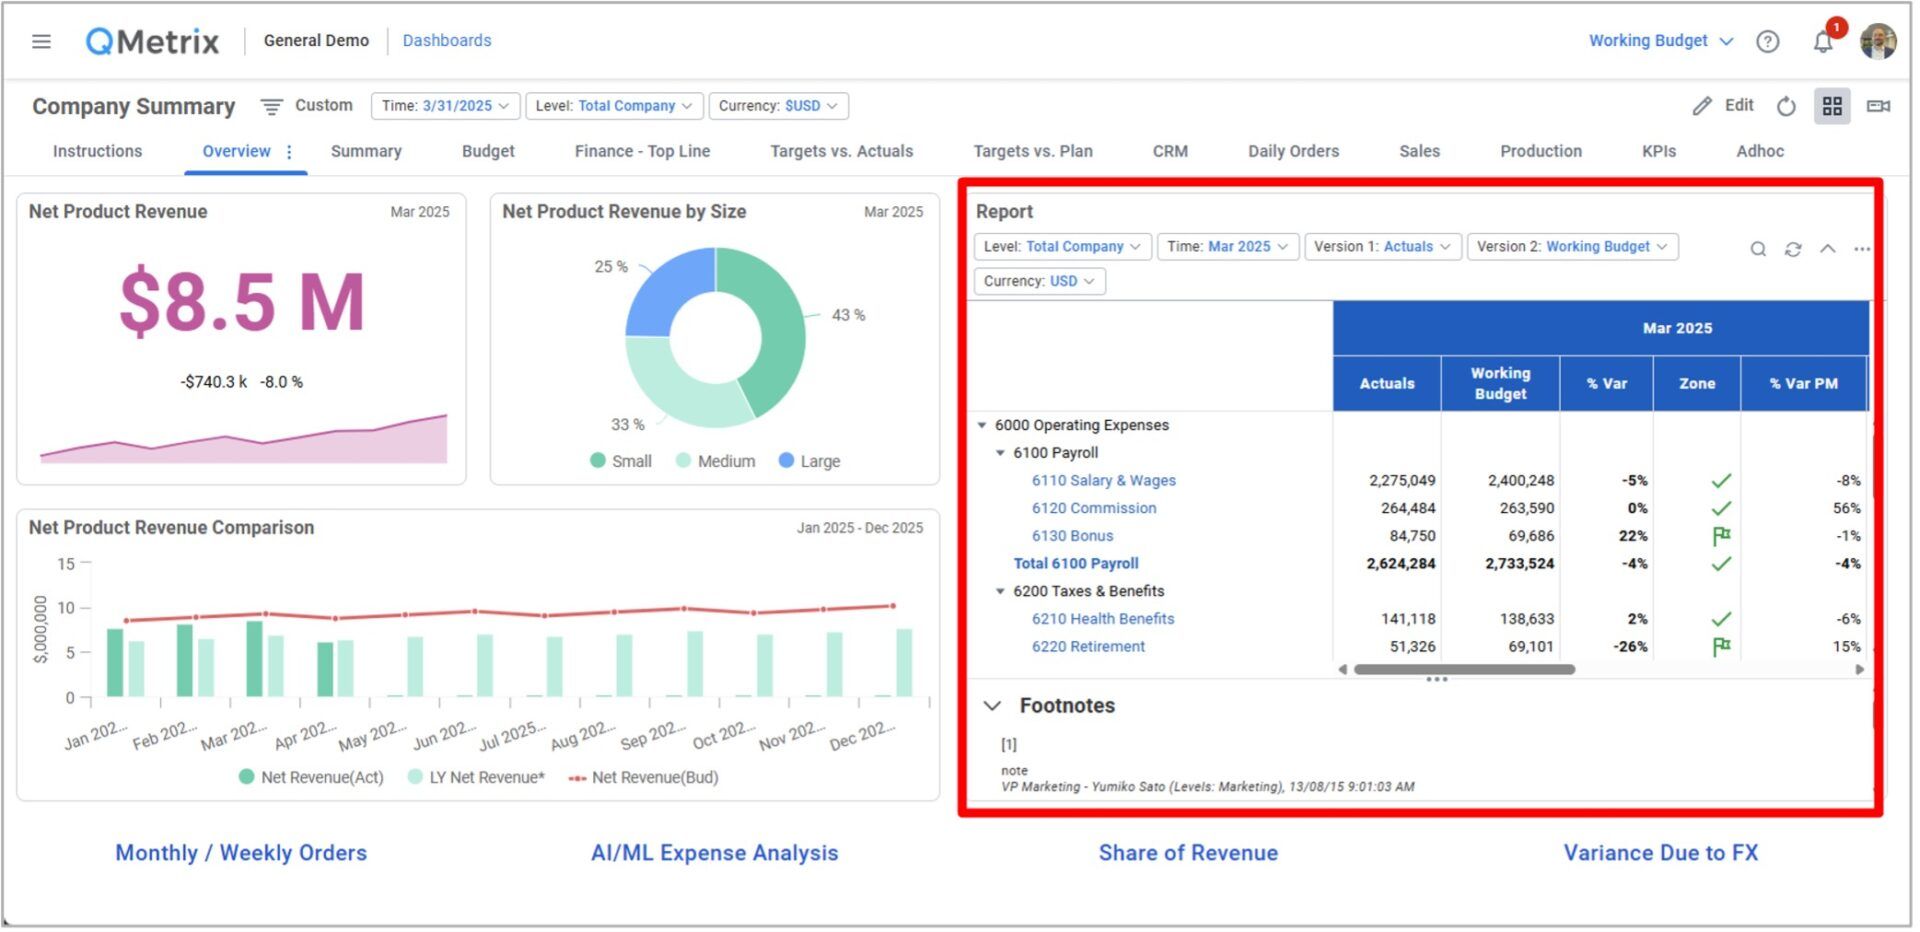
Say goodbye to clunky crosstabs and scorecards, you can now add Web Reports directly to your Dashboards!
Not only does this help us present key information to our audience, but we can also leverage conditional formatting to highlight areas for attention. End-users can drill through the reports and even enter their commentary using Line Notes.
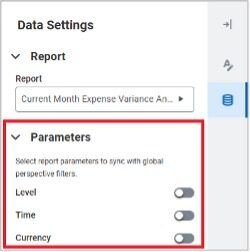
Do you want to make the report dynamic and aligned to your dashboard/perspective filters? Ensure you update the following parameter settings after adding the Web Report to your Dashboard.
Shared Scenarios
Have you been using the Personal Scenarios feature released back in March 2024? This feature was great for performing your own ad hoc ‘What-If’ analysis, however you may have hit a roadblock when attempting to share your insights with another Adaptive Planning user.
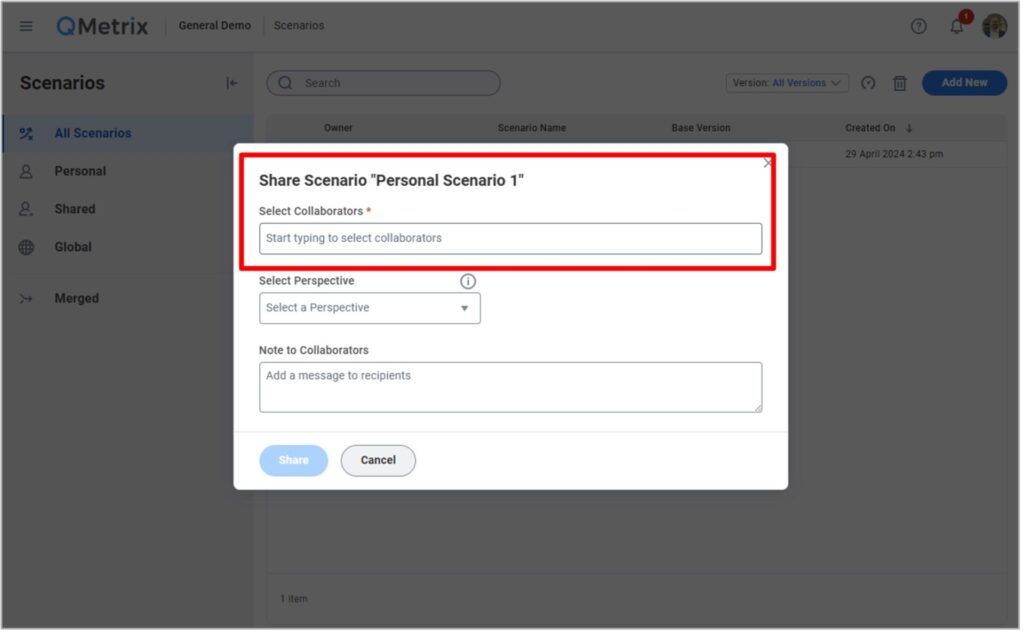
The good news is that path has now been cleared, as this release brings with it the ability to assign Collaborators to your Scenarios.
You can now work together on Scenarios and easily share their outcomes by leveraging your reports and dashboards.
To add a collaborator to your Scenario, navigate to the Scenarios section of Adaptive and follow the prompts.
Reports Bursting Through Scheduled Attachments
Do you have stubborn end users who just can’t seem to log in to Adaptive Planning to review their numbers?
The previous 2024R2 release included a new feature which allowed users to schedule and automatically issue a report (as an Excel attachment) via email.
The 2025R1 release has significantly enhanced this feature. Now, these attachments factor in level ownership and access rules to restrict what data is available on the report that is being distributed.
So previously, if you were trying to schedule a P&L report and distribute it to ten different cost centre owners, you would have needed to create ten copies of that report (and each report would need have its own schedule). Not any more – you can now leverage one ‘master’ P&L report, add up to 250 users to the schedule and let Adaptive Planning do the rest!
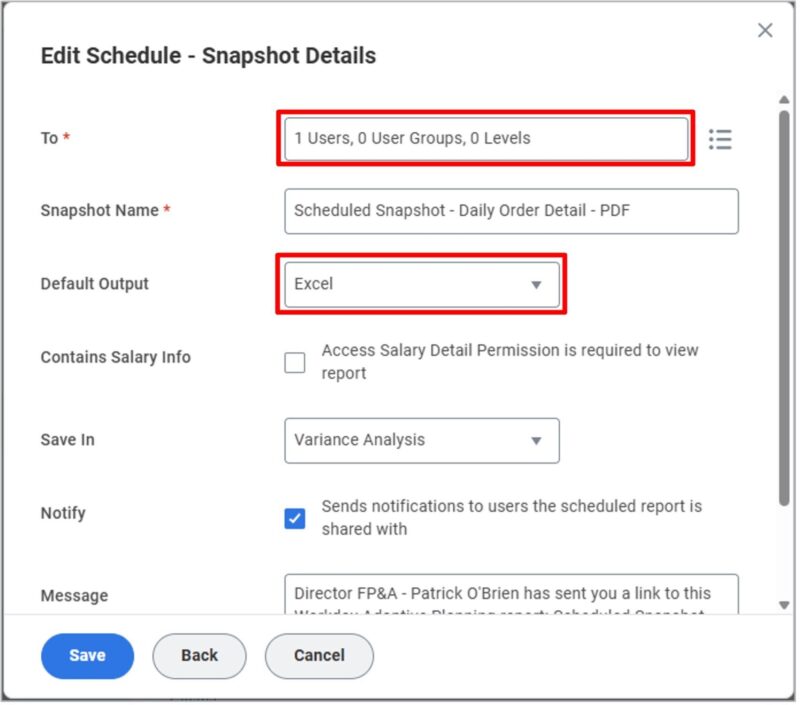
Whether they’re a stubborn user, or you just want to make their life a little easier, consider scheduling a report attachment.
New to scheduling reports? Refer to our previous release notes (2024R2) for guidance on getting started.
Perspective Folders in Dashboards
Has your Dashboards list gotten out of control? Do you wish you could organise them a little better? Well now you can try adding a new folder!
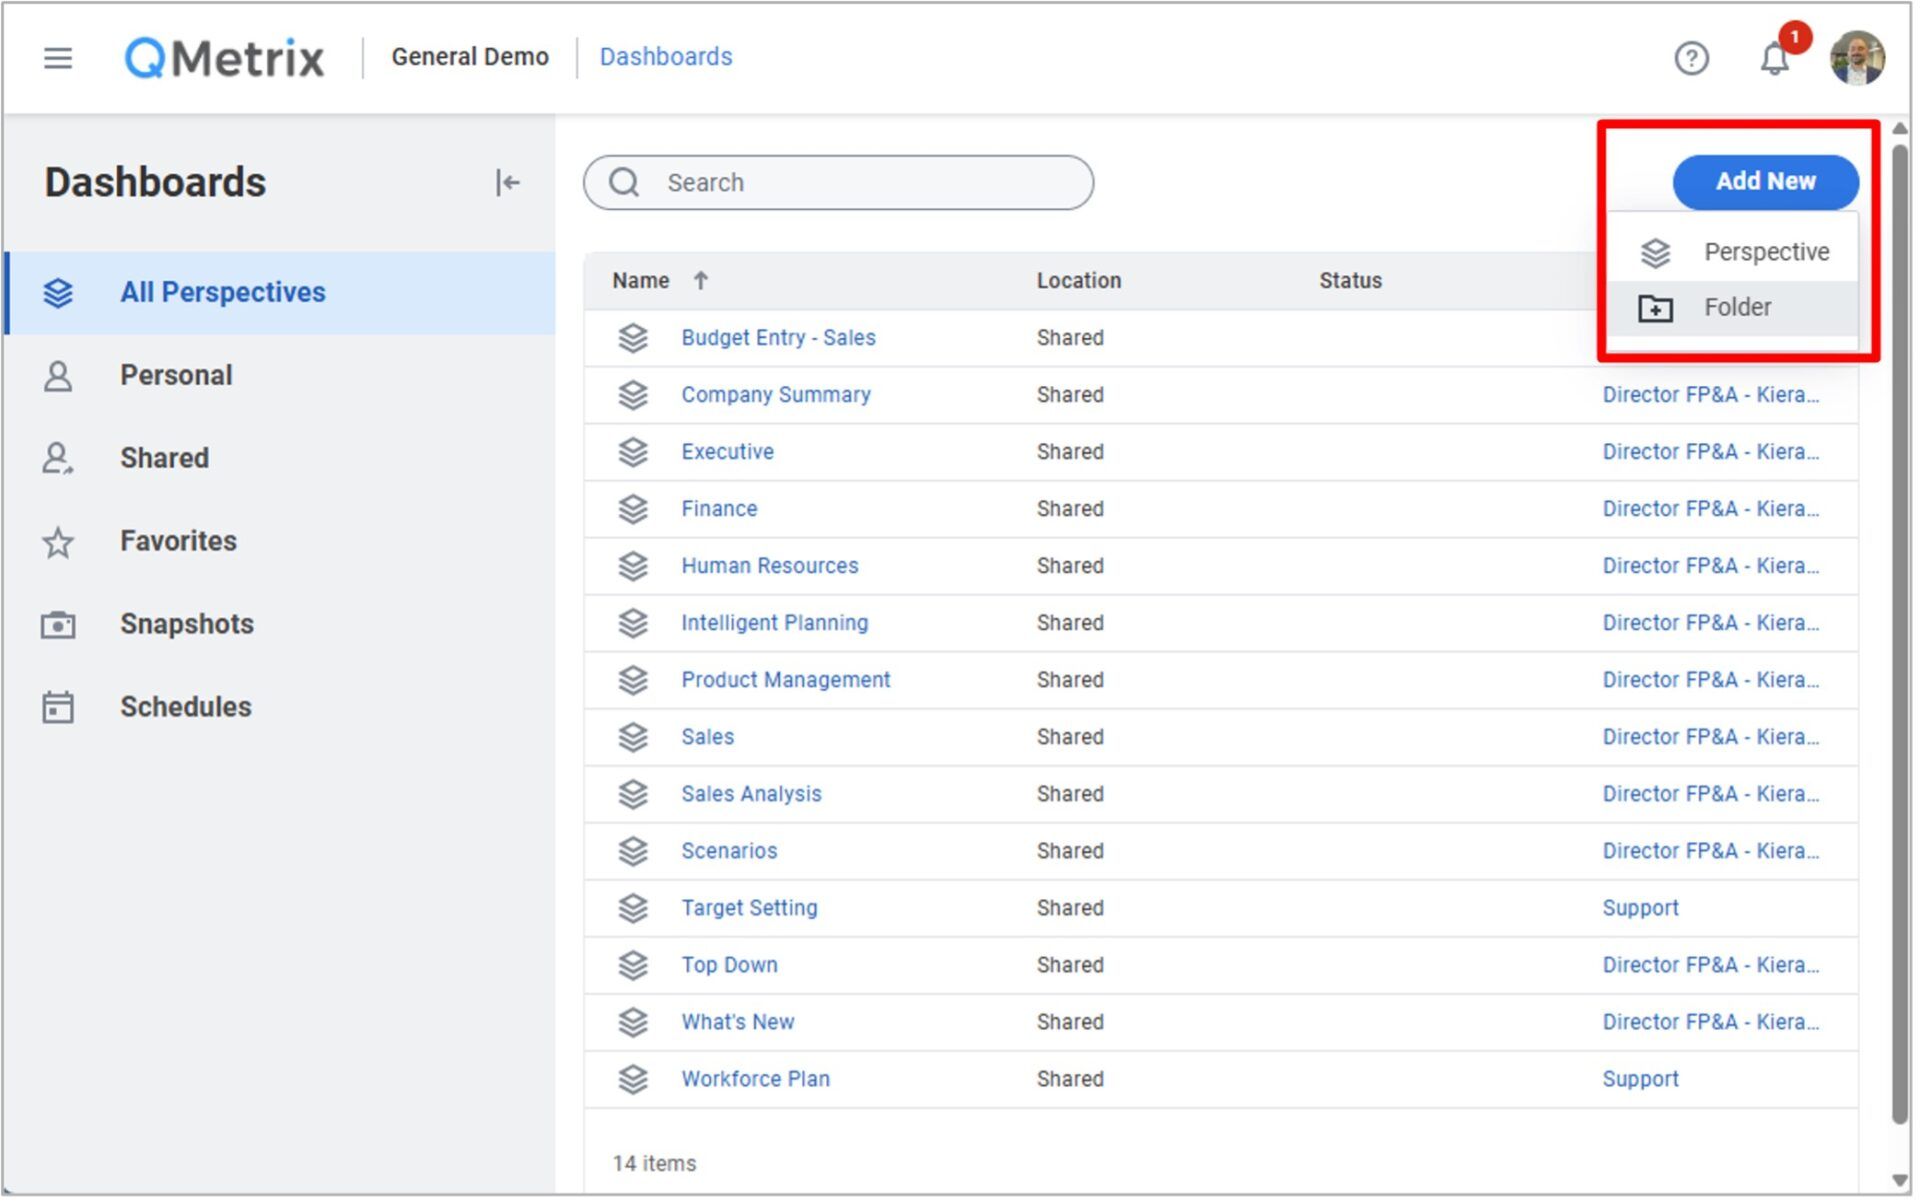
On the surface this new feature might not seem like much, but if you like keeping your instance neat and tidy – the introduction of dashboard folders will see to that!
If you are interested in reviewing these features in further detail (as well as any others), please reach out to your QMetrix Consultant or access the notes in the Workday Documentation.

Workday Adaptive Planning Health Check service
QMetrix provides a Workday Adaptive Planning Health Check service, where we review your instance and propose steps to optimise your instance so it continues to deliver value for your organisation.
Workday Adaptive Planning Release 2024 R2 – Review: September 2024
If you hadn’t noticed already, Workday Adaptive Planning dropped its latest round of enhancements on 21 September 2024. The new features cover various areas of Workday Adaptive Planning, ranging from simple changes to the interface, all the way through to exciting new product functionality.
Below we’ve highlighted what we think are the best new features and the ones you’re going to want to know about.
Writeback from OfficeConnect to Adaptive Planning
One of the most anticipated features in the 2024R2 release is the ability to writeback to Adaptive Planning – without leaving Excel!
Before you can try this one yourself, you’ll need to make sure you’ve updated OfficeConnect to the latest version, and that your Permission Set has the ‘Writeback from External Sources’ permission enabled.

Once you’ve satisfied the requirements above, you should see a new Writeback section within the OfficeConnect ribbon.

To use it, select a row or column in your OfficeConnect file that contains some cells you’d like to edit, and click Writeback.

OfficeConnect will then highlight any of the cells in your selection that can be written back to. As a general rule of thumb, you need to ensure you’re at the lowest granularity (i.e. you won’t be able to writeback to the Travel & Entertainment row because that is a roll-up, however you can edit each of the GL lines that make up that total).
Like when inputting data in a sheet in Adaptive Planning, any unsaved changes will display in a blue font. When you are finished editing, ensure you click the Submit button to push your changes back to Adaptive Planning.

What if someone overwrites actuals? Have no fear – writeback is only possible on planned data.
Translated Currencies for Actuals Versions
Does your source system treat foreign currency translations differently to Adaptive Planning? This has previously presented an issue requiring some clever workarounds; however this should now be a thing of the past.
After requesting Workday enable this feature in your instance, you will have the ability to import data into a sub-version of actuals in a single currency (irrespective of your level-currency configuration).
This means you can load your actuals data from your source system already translated, so no more reconciling issues if your ERP or Finance system stores daily exchange rates or unique exchange rates for individual transactions.
Neat huh? Reach out to a QMetrix Consultant if you’d like to explore this new feature.
Archived Versions for Data Freeze
While locking a version can help preserve your planned figures at a point in time (e.g. those very important Board approved numbers), there have been some limitations.
- What happens if the actuals overlay is altered?
- What happens when a linked account is reconfigured to include an additional filter?
These are no longer issues if you make use of the new Archive version check box in your version settings.

Once you’ve locked a version you now have the ability to archive that version, ensuring that all calculated and linked account values will be stored as values, in addition to the actuals overlay at that point in time.
Archiving a version also improves sheet performance when reviewing that version, so there are some great benefits utilising this function.
Send Scheduled Reports as Attachments
Do you spend countless hours each month generating and circulating reports? Well, this next feature will probably really excite you.
Workday Adaptive Planning now gives you the ability to schedule reports and distribute them as an email attachment.
This feature will need to be enabled in Administration > General Setup, and for the security conscious, password protection can be applied to all attachments.

You’ll also need to determine which users should have this feature, and update your Permission Sets accordingly.

Provided the above criteria has been met, when creating new Schedules you will see a new option under the Action section.

Then simply follow the prompts to set up your schedule which will send the report as an attachment.

At the moment it is limited to Excel attachments, but if you have users that are finding it surprisingly difficult to log in to Adaptive Planning, they’ll have no excuses when the report lands in their inbox!
If you are interested in reviewing these features in further detail (as well as any others), please reach out to your QMetrix Consultant or access the notes via the Workday Community.
This release note was written by Kieran Garriga, Principal Consultant at QMetrix.
Workday Adaptive Planning Release 2024 R1 – Review: March 2024
It’s here – the first release of 2024 for Workday Adaptive Planning was released on the 9th March, 2024. With this release, there is a combination of enhancements targeted towards the end user, as well as adaptive developers. Read below to hear about our favourite enhancements and how you can leverage these to take your instance to the next level.
Report Scheduling
With the 2024R1 release we see the addition of report scheduling for Matrix reports. This allows report administrators to create reports and either send a user group, or specific users report snap shots or notification reminders to run reports.
Users will notice a new Schedules tab from the reporting overview area, this is where you can manage all schedules you have created.

By exploring the more button from a report, two new options appear – Create Report Schedule and View Schedules. View will allow you to trace back and identify any existing schedules that have been created already for this report to limit duplication.

Under the Create Report Schedule property, administrators can specify the frequency, Day of month, time etc. There is also the option to either create a snapshot of the report, to send across to users in either PDF or Excel, or send a live report notification. Notifications can be used to prompt users to run reports.
Live report notification:

Snapshot:

When a snapshot schedule is created, further options are provided which allows you to specify the output (PDF/EXCEL), who to notify etc. Importantly, there is also the option to enable Access Salary Detail Permission is required to view report.

From the Schedules overview page, you can identify which schedules are notification links or snapshots by looking at the icon on the left.

Permissions
Users are only able to create schedules on reports that they own, and with the following permission enabled.

Personal What-If Scenario
Personal What-If Scenarios have been enabled in Workday Adaptive Planning and can be accessed via the Scenarios page via the navigation menu. This will only be visible to users who have the Access Scenario Manager permission set enabled. See details below regarding permissions

Users are able to create their own “Personal What-If” scenarios to test data changes without impacting the live data in your plan version. These can be created via the newly added Scenarios area from the navigation menu, or directly in the sheet or dashboard.
Scenarios page:

Via sheet:

Scenarios are tied to an existing budget version. In the screenshot above, our new version is tied to the “Budget What-If Scenario” and is nested directly under this version.
Any changes that are saved are highlighted in green.

These scenarios are then able to be viewed in reports and dashboards, allowing the end user to thoroughly test the scenario and analyse the changes.

The changes can be viewed in more detail by downloading the changes, via Scenario Manager. This requires the Download Scenarios permission to be enabled.

From Scenario Manager, Users are also able to merge the changes into plan versions in an efficient manner.
Permissions
By default, if a user has the Access Sheets – Editable sheet access permission enabled, they will already have access to the Create Scenarios and Merge Scenarios permissions.
Alternatively, If a user has access to the Version permission under Model Management Access, They will automatically have access to Create Scenarios, Merge Scenarios and Manage Scenarios.

Scope calculations on sheets
A new tab has been added to the Sheet Properties which allows you to specify start and end times for calculations. By limiting the cells the calculation is computing it will improve the performance of the sheet.
This new feature is available both on level assigned sheets and user assigned sheets. It is also available on modelled and cube sheets, however is currently not available on standard sheets.

As shown in the image above, if no “start calculating” and “stop calculating” times are specified, it will default to the start/end of version.
Headcount forecast planning – Workforce Planning
Users leveraging Workforce Planning can enjoy two enhancements with this release. Users are now able to create forecast plan versions based of your prior plan and actuals versions. This will make it easier to adjust the forecast using relevant data.
In Addition, users are now able to create positions directly from approved headcount plans, meaning that making adjustments is streamlined the manual adjustments are limited.
Note these features are only available for Workforce Planning customers, and as such, must have the feature enabled.
If you are interested in reviewing these features in further detail, please reach out to your QMetrix consultant or access the notes via the Workday Community.
Integrating source systems with Workday Adaptive Planning
Workday Adaptive Planning Release 2023 R2 – Review: September 2023
One of the most exciting features announced in this release is the addition of multi select filtering on Web Reports and Dashboards. In previous iterations of Workday Adaptive Planning, not being able to multi select parameters as an end user was a significant limitation. Multi- select filtering can be enabled through the parameter element options in web reports, and through context filter properties in Dashboards.
Analysis – Reporting and Dashboards
Web Reports
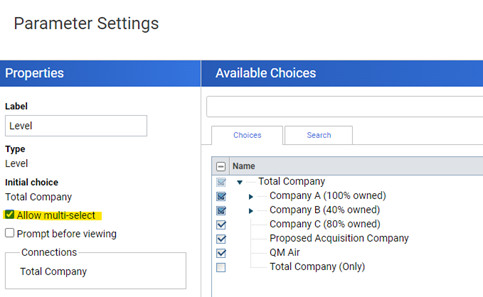
Please note the following exclusions for multi-select filtering
- Time, Version and Currency filters
- Sheets and Mapping dimensions (dashboards)
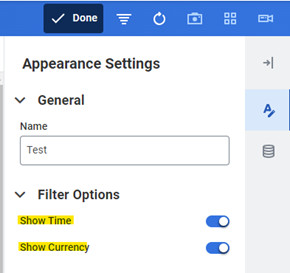
In addition to the multi-select filtering, users are also able to hide the Currency and Time context filters in dashboards to help consolidate the context filters and to remove unnecessary noise.
Model Management
Version Queuing
An update has been made in the way versions are handled in model management. When a new version is created, it will now automatically be visible in the version tree, and will include a status to show whether the version is “In progress”, “completed” or “failed”.

Versions will also process in the background, allowing users to navigate away from the admin page whilst the version is still processing, preventing time out issues.

Access Rules
The way access rules operate has also been updated with the addition of the “Grant all except” feature. A great example of this is that if a user needed access to all cost centres, except for 1 the rule would give them access to everything except the 1 cost centre mentioned. Previously it would work in reverse.

Performance
Sheets
Workday are continuing to improve the performance of cube sheets in dashboards. In the latest release, dashboard developers were given the option to choose a performance optimised sheet allowing users to modify and save the data enabling faster sheet load and save times. In 2023R2, cube sheet rate functionality can be run in an optimised mode. In its simplest terms, this will mean that users can edit, delete, copy, paste and save data within their optimised cube sheets. To enable this, navigate to the data settings.
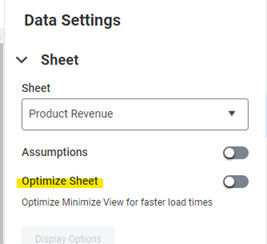
Improvements have also been made to the performance of web and OfficeConnect reports. Users can now run large, multidimensional matrix reports much more efficiently and with greater flexibility around the number of intersections possible.
NetSuite Specific Customers
Workday now manage the NetSuite Consumer Key and Secret for new credentials created. This will simplify the creation of credentials and the maintenance moving forward. This will not impact any existing NetSuite credentials or configurations present.
Integration
Workday have provided a new “Replace” import mode which will allow users to import into a standard sheet without needing to erase first. Only values that have changed will be updated/deleted.
*Note – this feature was released previously for cube sheets
That wraps up our favourite enhancements from the Workday Adaptive Planning 2023R2 release! Reach out to one of our consultants if you would like to learn more.
Workday Adaptive Planning Release 2023 R1 – Review: March 2023
Web Reports
Drill-down options
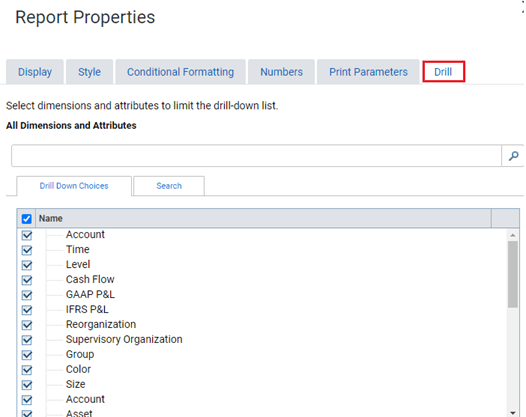
The drilling capabilities in Web Reports has been enhanced, allowing report developers the ability to control the drill through options for reports.
In Report Properties there is a new tab labelled Drill. Here, report developers are able to select and deselect the dimensions and attribute available for the end user to explore. If nothing is selected, all options will be available.
User experience updates
- Parameters can be expanded or collapsed from the report viewer
- Updates to the report snapshot and report download pages
- Ability to cancel and return to the previous page when on the report prompting page
- Ability to refresh entire matrix report viewer after making a parameter change or selecting save as
Dashboards
Some of the most exciting enhancements that have come out of the Workday Adaptive Planning 2023R1 release are related to dashboards.
Scatter Charts
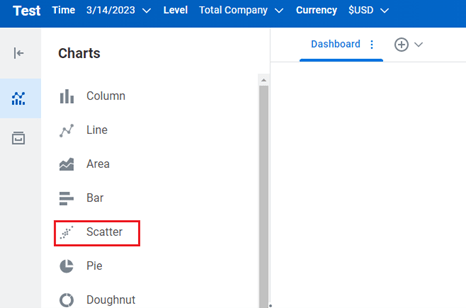
Scatter charts have been introduced in Workday Adaptive Planning dashboards. This can be found alongside all of the other visualisations available for analysis.
Web Report Links
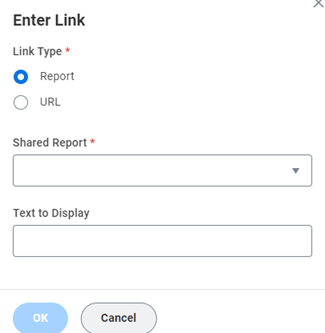
Users are now able to set up links on dashboards to web reports, making the process of navigating between dashboards and reports easier. It also allows you to analyse your plans from a single location.
From the charts option, insert a Text. From the popup menu, select Insert Link
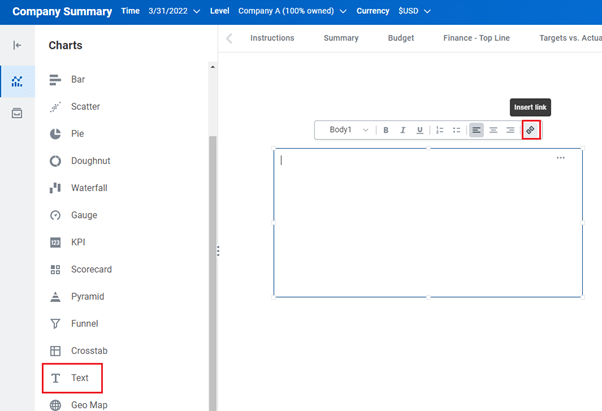
You can then either select a Shared Report or insert the report URL.
Snapshot schedules
Dashboard snapshot schedules can now be paused and resumed on command. A new column is also included in the schedule to identify whether the schedule is paused or active.
Sheets on dashboards
The “Optimise Sheet” option has been enhanced. Specifically for modelled sheets, when the optimise sheet property is enabled, users are now able to:
- Add rows
- Copy and Paste multiple rows
- Save changes made to the sheet
- Add, edit and delete values.
For all sheets, when the “Optimise Sheet” has been enabled, there is also the option to change the column width and view cell notes in a pop-up window.
Sheets
Creating a new Level Assigned or Assumption Sheet has been made easier with the addition of an Add New button from the Sheets overview page. Similar to the function in the Report Overview Page, this will allow you to quickly create a new sheet.
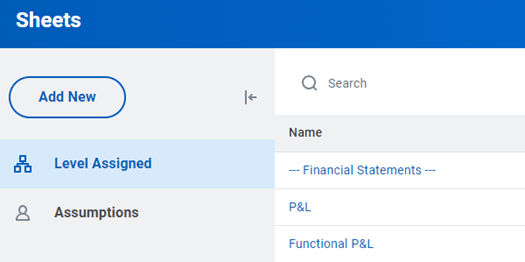
There is also a new menu for each row which will allow you to rename, edit and delete the sheet.
Display cube sheet size
Users are now able to view the percent of capacity a cube sheet is consuming by version. If capacity on a cube sheet is fully consumed, the sheet will not be able to display data.
To view the capacity of a cube sheet, select Edit next to the sheet name from the overview section of either the Level assigned or Assumption sheet. From here, the new View Capacity option will appear.
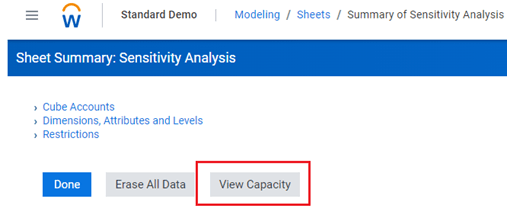
Users will then be prompted to select a version.
Please note – this function is only available on cube sheets.
Row totals in cube sheets
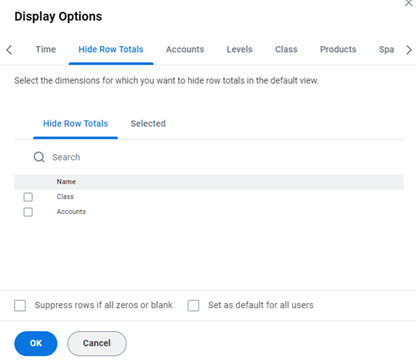
Users can now customise which row totals are visible on cube sheets. By navigating to the display options in a cube sheet, select the Hide Row Totals tab.
Modelling
Version availability for list dimensions
There is now a List dimension property available under dimension details.
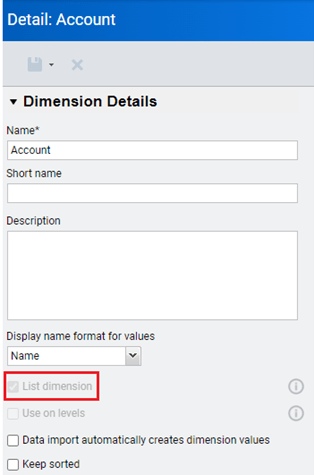
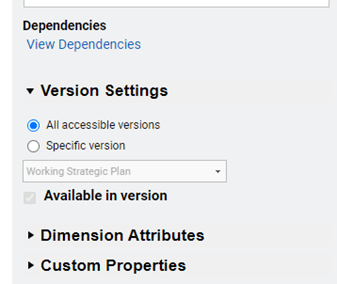
By selecting one of the dimension values, we can see that there is a version settings property, allowing you to select which version to make available.
By selecting Generate printable view you are able to Bulk update the dimension values to specify whether they are “available” or “not available” in the version column.

Dimension dependencies
It is now easier to see where a model uses and references dimension values through the view dependencies property. This allows you to find and erase data against a dimension prior to deleting the dimension.
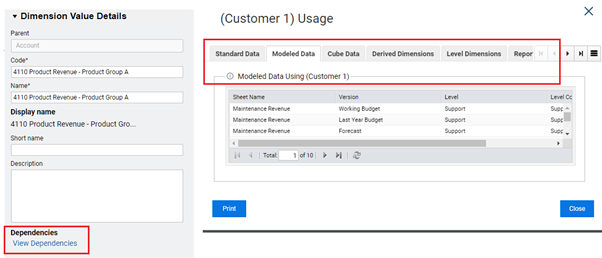
Under view dependencies, there are new tabs which provide further information around issues that must be resolved before you are able to delete the dimension value.
Integration
Workday Adaptive Planning have removed support for NetSuite 2018.1. If this impacts you, please reach out to your QMetrix consultant for further assistance.
Workday Release 2022 R2 – Review: September 2022
Alternate Calendars
In previous releases of Workday Adaptive Planning, instances were limited to one calendar. Users that required an alternate time rollup were forced to create a separate instance. With the 2022R2 release, users are able to import up to three alternate calendars.
When multiple calendars have been imported, a calendar prompt appears in the time area of Modeling, enabling you to select the alternate calendars. When a calendar is selected from the prompt, the strata rollup in the calendar prompt will automatically update.

These alternate calendars are available in sheets, web reports, OfficeConnect reports and dashboards. In reporting, all calendars will be available in the elements tab under Time.
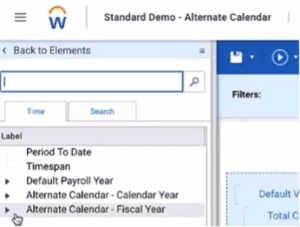
In dashboards, they will be available under the chart time settings and time filters.
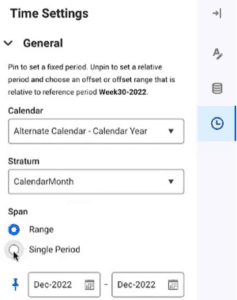
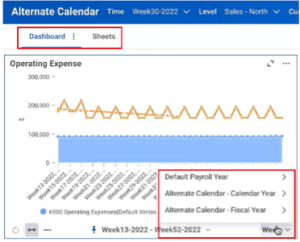
Calendars can now be renamed so that the alternate calendars can have a meaningful name to differentiate from the others.
Update and Append Attribute Structure
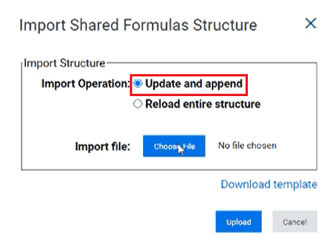
The Update and Append feature for attributes has been enhanced, allowing the addition of new accounts, dimension attributes and dimension values to be updated within a single import. Users will notice that the “Append” option is replaced with “Update and Append” for account, dimension and level attributes.
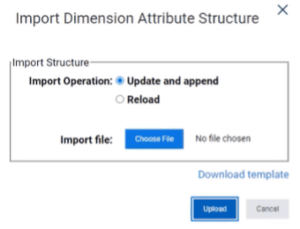
Contra Accounts
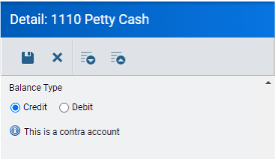
Users now have the option to edit the ‘Balance Type’ of an account within the GL Accounts area of Model Management. Changing the Balance Type to settings opposite to the parent account create Contra Accounts. For example, changing an Asset GL account to a Credit will reduce the rollup total of the parent account without needing to enter a negative amount.
Dashboard enhancements
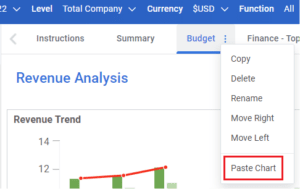
The Dashboarding feature in Workday Adaptive Planning has been enhanced with copy and paste functions. Users can now copy charts and dashboards and paste into the same, or a new perspective. The “Duplicate” chart option has been replaced with “Copy”.
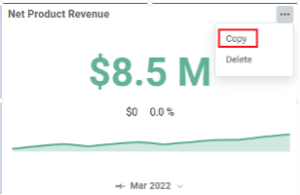
When selecting to add a new dashboard, new options appear allowing you to create a new dashboard or to paste dashboard. You can also paste charts to an existing dashboard by selecting the name and Paste Chart.
Users are also now able to bulk add rows on cube sheets and sheet dials on dashboards. When adding a row you are able to select up to 6 dimensions and create a new row for each of them. This multiselect feature is only available on the innermost values in your dimension structure.
Streaming data for the Planning Data Source
There is now a feature enabling you to stream data using an API (v33 or higher) from the data source.
Export Configurable Model Data API
Users are now able to specify which modeled sheet columns to retrieve by filtering on them in the exportConfigurableModelData filters. If no columns are specified, all columns will be returned.
For this feature to work, users must set the modeled sheet element “GetAllRows” to True and be using an API of v33 or above.
Security APIs for Adaptive Planning
Security APIs are now available to use to set up custom integrations by request only. This is recommended only for instances with 100 or more planning users.
Adaptive Planning Permissions
To assist with downloading data to excel from reports or sheets, two new permissions are available. These are:
- Report data to excel
- Sheets data to excel
There is also a new permission “Create Personal Reports” which allows users to create and view both personal reports. When this permission is disabled they will only be able to view shared reports.
Workday Adaptive Planning Performance and Scalability
Processing time has been improved in the 2022R2 release, increasing performance and efficiency in data imports.
Workday Release 2022 R1 – Review: March 2022
Update and Append Structures for Import
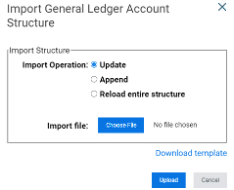
Update and appending account structures has been streamlined by removing the existing “update” and “append” options and replacing it with “update and append”
Previous:
New:
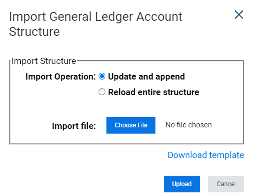
This allows you to update the existing account, level and dimension structures all within the one import process.
User Experience
Dashboards
The dashboard overview page has been enhanced and now is inline with the reporting overview page. A menu will appear down the left-hand side, separating dashboards and perspectives into their respective folders – whether they are personal, shared, snapshots or schedules.
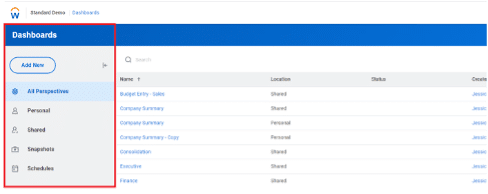
Viewing and accessing perspectives has become easier with the addition of a search bar at the top of the screen. Users are also able to sort the perspectives in the folders by name, creator and created date.
When users checkout a perspective from the shared folder, a copy of the perspective is saved in the personal folder with the status column indicating that it has been checked out. At any point in time, the shared perspective can be accessed from the more menu.
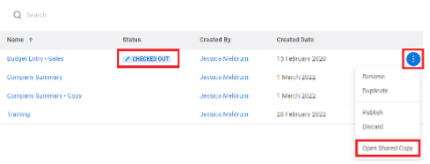
As soon as users publish the perspective it will be merged with the shared perspective.
Matrix report viewer
The user experience for matrix reports has also been enhanced in this release. In previous versions, parameters were restricted to only display two on the menu bar, with the remaining hidden behind a change parameters icon. Now, parameters have been shifted down to sit just underneath the menu bar, making filtering reports a lot easier and more intuitive.

The icons on the menu bar have also been condensed – The save icon now uses a drop down arrow to allow the user to select whether to save or save as. Similarly, the download icon is condensed which prompts users to select to export the output into PDF or Excel.

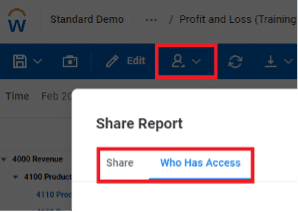
Users can share the report and also see who has access to the report from the share icon. Using the advanced tab will allow you to select whether you want to show data on the report regardless of level access. (This should be used with caution).
Previously, navigating back to the reports overview page from a matrix report viewer was tedious as the back button would take you straight back to your favourites folder, irrespective of where you ran the report from. Now, Workday remembers the location at which you ran the report from and will direct you back here from the report viewer.

Delay interface changes
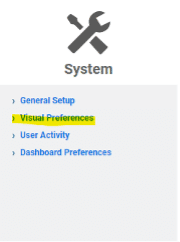
Users are now able to delay the interface changes until the following release through the change visual preferences option. This can be found under Administration>System>Visual Preferences.
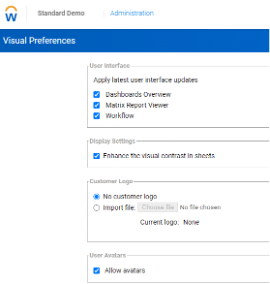
Modeling
Level, dimension and attribute codes for display names
Users are now able to control the way in which levels, dimensions and attributes are displayed. Along with the standard code and name, there is now a display name (similar to short name). Underneath the description, users can control the format of the display name. This display name can also be used as a label in OfficeConnect reports.
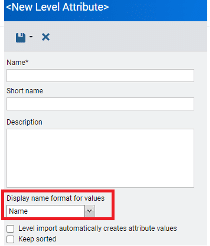
Cell Explorer in Cube Sheets
The cell explorer feature from cube sheets has been enhanced to pick up the dimensions used in the cube sheet to filter the target cube sheet. This feature makes the process of viewing and adjusting data from a cube sheet a lot more seamless then having to filter the target cube sheet for the required dimensions.
It is important to note that this feature will only work for dimensions that are shared between the source cube sheet and the target cube sheet. When the target cube sheet includes dimensions that don’t exist in the source cube sheet, not filters will be applied.
Hide/Unhide columns on modeled sheets
Within the display options menu from modeled sheets, a new hide column checkbox is available to allow users to choose which columns to show and hide. Users are also able to deselect the Hide column checkbox to prevent other users from hiding the columns.
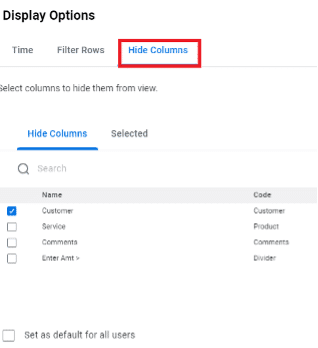
When the hide column checkbox is enabled and selected columns are hidden, a carrot icon will be displayed to indicate that there are hidden columns.
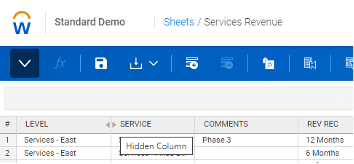
The hide columns option is also available on dashboard sheets.
When using the hide columns checkbox in a dashboard sheet, the hidden behaviour will automatically apply for all users who you share the perspective with. They will still have the option to hide/unhide columns from display settings. The reset to default property will reset back to the original perspective as per the administrators settings.
Workday Release 2021 R2 – Review: September 2021
Reporting
Reporting interface
In the Workday release 2021R2, the reporting overview page has seen some great enhancements and is now more aligned with Workday.
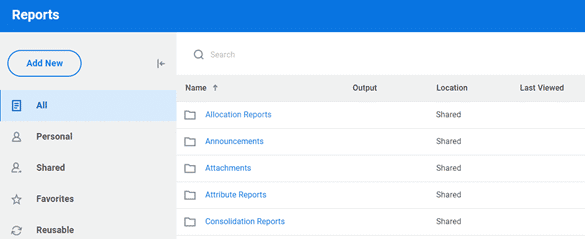
Workday users will notice that the reporting overview page will automatically land on the favourites folder. In addition to the existing folders, a new folder called “All” has been created. This folder holds all reports within the interface and can be searched to help locate reports, regardless of the folder they sit under.
Enhanced OfficeConnect reports functionality
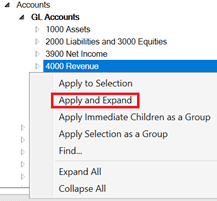
In the 2021R2 release, the expand elements feature has been enhanced by allowing users to apply and expand in one click. By right-clicking on an element from the reporting pane, users can select Apply and Expand to add the expanded elements to a row or column.
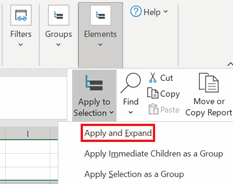
Alternatively, users can also use Apply and Expand from the OfficeConnect menu.
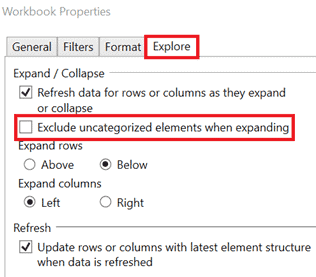
In addition, users can now exclude the uncategorised and “only” elements from an expansion through workbook properties.
Perspective Context Filters
Context filters have become more efficient and easier to use by introducing a bulk save feature – meaning that multiple filter selections can be changed and refreshed once, rather then refreshing after each filter change.
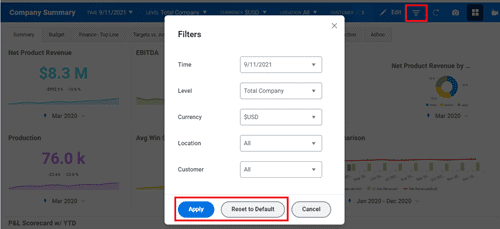
Users can still change the parameters from the toolbar at the top of the perspective, however these will refresh individually.
Users are also able to reset the filters back to their natural state, prior to selections being made.
The Workday release 2021R2 enhancements also include the ability to remember context filter selections after closing the dashboard, meaning the next time you open the dashboard the filters will already be applied as per your previous selections.
Sheets Management
The sheets overview section has had a major facelift. Both level assigned sheets and assumptions are easier to locate and switch between by bringing them together into the one window. Sheets can be searched using the search window and sorted for convenience.
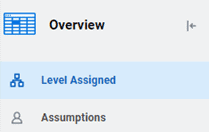
When users use the Explore Cell feature from sheets, they will notice that the audit trail and transaction details have been rearranged to make it easier to access.
Saving standard sheet view
Users are now able to save more view options in sheets, reducing the need to change the view each time a sheet is opened. Viewing by account or by level has also been made easier by allowing you to change the display in the minimised dashboard view as well.
Cube Sheet performance
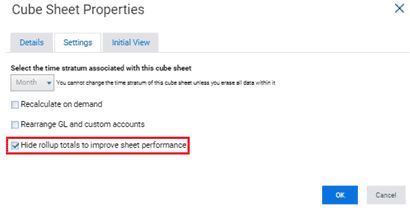
Cube sheet performance has been improved by allowing users to hide rollup totals. Not only does this feature improve performance, but it also improves the visibility of data on the sheet. The more totals there are, the more indentations displayed on the sheet.
This was often criticised as it made the sheets look messy and chaotic, yet the only way users could clean up the sheet was to manually deselect the roll up name for each dimension and attribute. Hiding rollup totals will alleviate this issue and make the cube sheets more readable.
Suppression in explore cell
When using the explore cell feature in reports and sheets, suppression will automatically be enabled. This means that rows with blank or zero values will be hidden, providing better data visibility.
Users are also provided with the option to show zero and blank values by selecting the checkbox at the bottom of the screen.

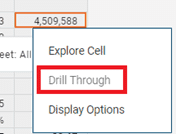
Users are also now able to drill into the transactions on cube standard accounts from both the explore cell, as well as when you right click on the cell from the sheet view.
Modelling Management
Custom Accounts
Historical data can now be preserved when users add a new default/master formula to general ledger and custom accounts.
Previously, all data in all versions – including data in locked versions – were replaced when a default formula was introduced.
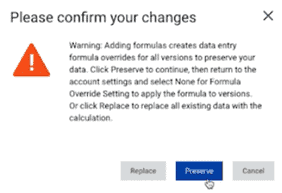
Now, when a new formula is saved, users are prompted with the option to either Preserve, which create data entry overrides and use the default formula for new versions – or Replace, which replaces all existing data in all versions (previous behaviour).
Workday Release 2021 R1 – Review: March 2021
The first release of Workday Adaptive Planning for 2021 is here! The 2021R1 release has introduced new features for modelling and reporting and addressed some areas of improvement from previous releases.
Listed below are some of the exciting enhancements users can leverage to improve their budgeting and forecasting for 2021 and beyond.
Suppression in dashboards
In previous releases of Workday Adaptive Planning, users were not able to suppress 0 values in visualisations. This meant that when a column/bar had no data, a blank column/bar would appear. This caused some frustration for users as it had a negative impact on the visibility of the chart.
The Workday 2021R1 release has now introduced a suppress feature for charts which will eliminate this concern.
The screenshot below is an example of how the previous release handles 0 values in visualisations. As you can see, the Function (Uncategorised) still appears even though there are no values.

If you compare the first screenshot with the screenshot below, you will notice that the Function (Uncategorised) column has been suppressed as there was no data.

Something to consider with this feature is that suppression will not apply when the visualisation is broken down by time, and it will also not apply to geo maps.
Dashboard view settings
The 2021R1 release includes a new update for context filters in dashboards. Users can change the default level and time by enabling the override default property on the context filter. This has allowed for greater customisation, allowing users to modify the dashboard filters to suit their requirements.
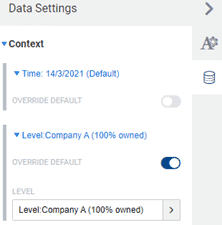
The introduction of this feature is an exciting step in the right direction. However, there are some notable limitations. Users are currently unable to set a default time period for a relative date (for example, prior month or current month). You are also only able to override the default values for the time and level filters.
Sheets on dashboards
Using sheets in dashboards has become easier in the 2021R1 release with the enhancement of the perspective toolbar.
When using a sheet in the maximised view, the context filters from the perspective toolbar can be used. If there are common filters between the perspective toolbar and the sheet, they will be disabled from the sheet view, which means users will need to use the filters from the perspective toolbar instead.
OfficeConnect ad-hoc analysis
The 2020R2 release introduced the ability to expand and collapse rows and columns to allow more dynamic reporting. This feature was great because users could quickly navigate between a high-level view of parent accounts and/or years or a more detailed view of the children. This did have some limitations, such as the existing report structure interfering with the expand direction as well as limited elements available for expansion.
The 2021R1 release has improved this feature and will help make reporting in OfficeConnect easier and more user-friendly.
Firstly, users are now able to control the direction in which rows and columns expand. From the Workbook properties, there is now an explore tab which hosts these properties.
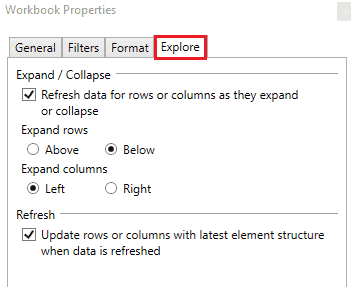
There are also options that allow the user to control the level at which to expand to. Under Expand, there are a few options:
- “Expand”, which will expand to the next level down (this was the previous behaviour)
- “Expand All”, which will display the entire structure
- “Expand to leaf level”, which will only show leaf accounts
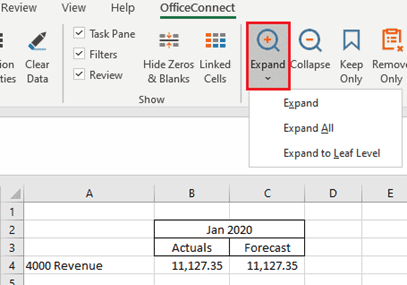
From the ribbon, two additional properties work hand-in-hand with Expand and Collapse. The Keep Only property and the Remove Only property will allow users to select specific rows or columns to “Keep” or “Remove” from an expansion. This gives users more flexibility around which accounts they want to show and hide. It’s important to note here that using these features will break the expansion for further collapsing purposes.
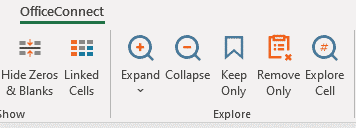
Finally, users are now able to Expand and Collapse on custom dimensions and attributes.
Drill down from cube sheets
A new drill-through feature for Actuals on cube sheets has been implemented in the 2021R1 release.
Now users can either drill through by right-clicking on a specific cell from a cube sheet or using the explore cell feature. This will drill through to a Workday Adaptive Planning report, which has been set up through design integrations.
As mentioned, users must specify which report to drill through to from the design integrations page. From here, you can also specify which parameters will apply to populate the report.
One of the great benefits of this feature is that you can specify different drill through reports for different accounts, allowing greater flexibility for reporting and analysis.
A few notes to consider is that the drill-through feature is not applicable for attributes or parent accounts.
Derived dimension values on modelled sheet rows
The 2021R1 release has seen some improvements for mapping rules in both derived dimension values and dashboards. This improvement introduces a new inheritance feature in which mapping rules applied to a parent level will automatically apply to the children of such accounts. If a mapping rule is applied at a child level, it will override the inheritance for that one instance.
This feature can be turned off by request if there is a specific requirement to have dimension mapping rules applied to a specific level.
Other notable inclusions in 2021R1
The following features are issued with a word of caution. Changes to accounts and versions can impact the current setup and structure of your model. If you are interested in making any changes to your accounts, it is advised that you contact a QMetrix consultant.
Calculated accounts
Creating calculated accounts has become more flexible in the 2021R1 release by introducing a data entry override setting. This will allow users to override the formula for a particular version and allow them to enter values without affecting the calculations for other versions manually.
This feature is available on calculated cube accounts, custom accounts and GL accounts with master formulas.
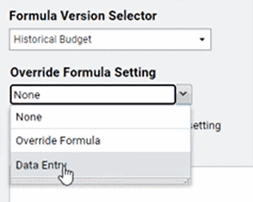
The introduction of a “disable version specific formula” setting property allows the user to delete the override formula. When this is enabled, the account will pick up the default formula for all versions (including locked versions).
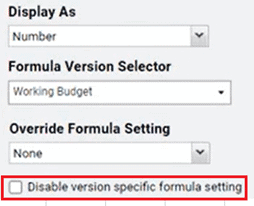
When a version was copied in previous releases, it would only include the default formulas, leaving behind any override properties. Now there is the option to Copy All Override Formulas when you copy versions.
Import cube and modelled accounts
There is now an import account structure button in both the cube and modelled sheet builders. This feature is an excellent addition as it will make managing and updating the account structures of modelled and cube sheets a lot more efficient.
Once you have exported the account structure through Generate Printable View, you will notice that there is now an additional column that holds all the account formulas. With this export, you can modify account details or create additional accounts and then reload this back in through the Import Account Structure button from the toolbar.

Workday Release 2020 R2 Review: September 2020
Workday Adaptive Planning’s 2020R2 release has seen several enhancements from all aspects of their interface, including Reporting, Modelling and Integration. These enhancements have helped streamline the budgeting and planning process for many of our Workday users.
Some of the more note-worthy enhancements are listed below.
Reviewing Sheets and Dashboards
A new preference feature has been introduced for sheets in dashboards that allow individual users to set their own sheet preferences. This allows for a more customised and personal approach as preferences can be set to suit individual needs and requirements.
Workday customers can interact with perspectives as usual. However, when they change filters or a display option, their preferences will be saved and be applied the next time they open the perspective. This feature is unique, which means that each user can have their own preferences saved for the same dashboard – eliminating the need to provide multiple views for a different audience.
Context Filters
Context filters on sheets have become more dynamic and user friendly by controlling the filter options available. When an attribute is selected from a context filter, the subsequent level and dimension filters will only be populated with options relevant to the attribute. Not only will this feature make it easier for users to get the most value out of their sheets, but it will also eliminate combinations of attributes, dimensions and levels that do not apply to each other.
Workday users can now filter sheets based on whether an element ‘Is Empty’ or ‘Is Not Empty’ will become particularly useful in data validation processes and check for data entry errors.
Reporting
Sharing and Reporting in both the web application and OfficeConnect has been improved in several ways.
Sharing reports has become more dynamic by allowing reports to be shared to specific users or user groups and level access. Report owners can now nominate precisely who they want to be able to view their report.
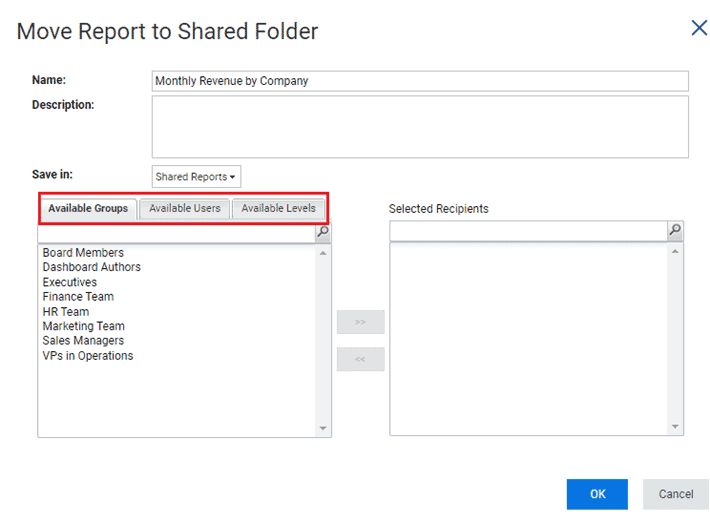
When a report is shared with a user, the user will also need the necessary level of access to view the data. Whilst they may be able to run a report that has been shared with them, they will only see data if their level of access allows them to do so.
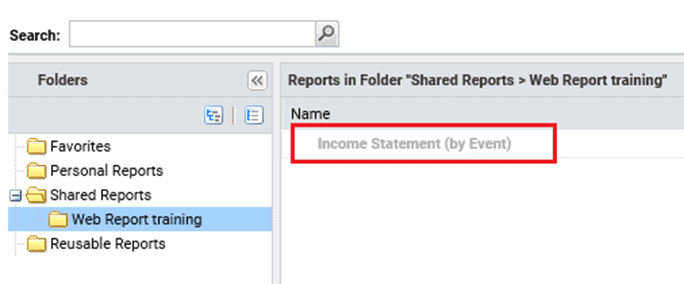
Reports that are saved under a shared folder will be visible to all users who have access to the shared folder – however, if a user hasn’t been given specific access to a shared report, the report will appear as disabled and cannot be run.
OfficeConnect reports have also seen some great enhancements.
In the previous 2020 release, a grouping concept was introduced, which allowed children accounts of the same parent to be grouped. This meant that when a new child account was added into the model or an account was removed, the elements and groups could be refreshed and updated to make the change visible in the report. Whilst this made the process of updating reports much more seamless, there were some concerns.
Any existing OfficeConnect reports built before the 2020R1 release were not eligible for grouping. That is – the only way to apply the grouping in an existing report was to rebuild the entire report’s structure. This meant that a lot of users were not able to reap the full benefits of this feature.
In the 2020R2 release, this feature has been enhanced. Users can now update existing reports built before the 2020R1 release and utilise the grouping functions.
Users can either use the Group property from the toolbar or the context menu by selecting the accounts from the report.
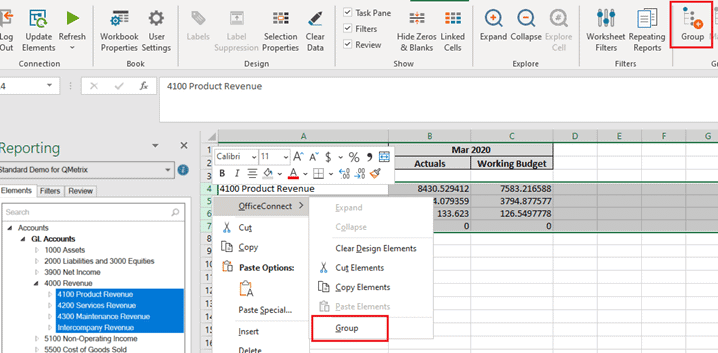
When using the grouping function, all elements must belong to the same parent element.
Groups can now be managed more easily through the Manage property.
The 2020R2 release has also removed the manual process of updating elements by providing a Workbook property to Include Update Groups in Refresh. This means by default; new elements will become available once the report is refreshed.
Modelling
The Workday Adaptive Planning 2020R2 release has introduced the concept of Intelligent Planning and Machine Learning to planning. Machine learning principles are applied to detect and predict any anomalies or outliers in planned versions. This is a brand-new concept for Workday Adaptive Planning, and to enable anomaly detection, users must submit a support ticket.
Using account formulas has become easier with the concept over override formulas. When a version is locked, account formulas are automatically saved as an override formula in that version. This allows edits and modifications to be made to the formulas without impacting the locked versions.
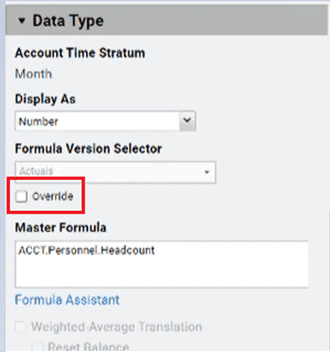
The process of updating shared formulas has also been enhanced. The previous process of modifying a shared formula required users to reload all of the shared formulas for a version back into Workday Adaptive Planning.
In the 2020R2 release, there is an option to update and append, which enables users to modify and reload specific formulas.
