
From the CEO to the sales and HR teams, everyone relies on key reports to understand how their organisation is performing and to make evidence-based decisions.
However, often the real challenge lies in accessing the reports in a timely manner and making sure they accurately portray key information with consistently applied business rules and definitions.
Reports are typically needed daily, weekly, monthly or simply on demand. Relying on finance teams or line of business personnel to create these manually is not only time consuming (time better spent analysing said reports) but even the best people are prone to making mistakes and churning reports out for routine’s sake. Furthermore, these reports tend to be static and don’t provide any further analytical capability.
Here are 4 typical challenges and things to consider so you can create accurate, timely, insightful reports that engage stakeholders.
1. Clean and consolidate data
The first step in generating meaningful reports is to ensure the underlying data is properly understood, and business rules and assumptions are consistently applied. This concept is about developing a business-wide “single source of truth” to ensure the data behind reports can wholeheartedly be trusted.
This avoids the situation where various stakeholders are bringing contradictory reports to meetings and time is wasted debating the validity of numbers rather than making important decisions.
Typically, data used to build reports can come from multiple disparate systems and be represented in various formats. Consolidating and ensuring the data is consistent across these systems can be a cumbersome process.
Inconsistencies between systems – for example different coding structures used for cost centres – may seem minor, but can become a big problem when trying to collate massive amounts of data.
The issues of manual data consolidation and human error can be resolved using fit-for-purpose technologies which can be set up for automatic consolidation, with rules applied to eliminate inconsistencies and errors and to provide clean and consolidated data.
2. Data security
When automating the consolidation of data and providing easy access to corporate reporting for users, there may also be the need to secure the company’s data and information within each of the business teams. It may be vitally important for department managers to not be privy to other areas of the business, resulting in the further challenge of locking down what people can see.
Putting in such controls is sometimes just not possible within a spreadsheet reporting environment – often requiring manual manipulation of reports just to ensure the distribution of information is controlled.
With a dedicated technology, organisations can build security around the data that locks down individuals or cost centres based on appropriate access. This limits the viewing of information to the right people without needing to create multiple copies of the same report, thereby simplifying report distribution and limiting the reports in circulation.
3. Report design
Once an organisation has clean, consolidated data with the right data security in place, the next step is to determine how best to represent it so consumers are able to quickly glean the key information they need and can seek further detail, if they need it.
One of the challenges of designing a report is that not everyone wants the same information and in the same way. The board of directors may request high level figures on how the business is performing on a macro basis, while a regional manager might only want to know how his/her region is tracking with more granular key performance indicators.
Understanding the audience (who is consuming a report and what they need to see) is vital and may take several iterations in development.
A common mistake is to present too much information or to be too detailed – often it is only the exceptions or outliers that the user wants to know about. Being able to “drill down” or access further detail in an automated fashion is necessary.
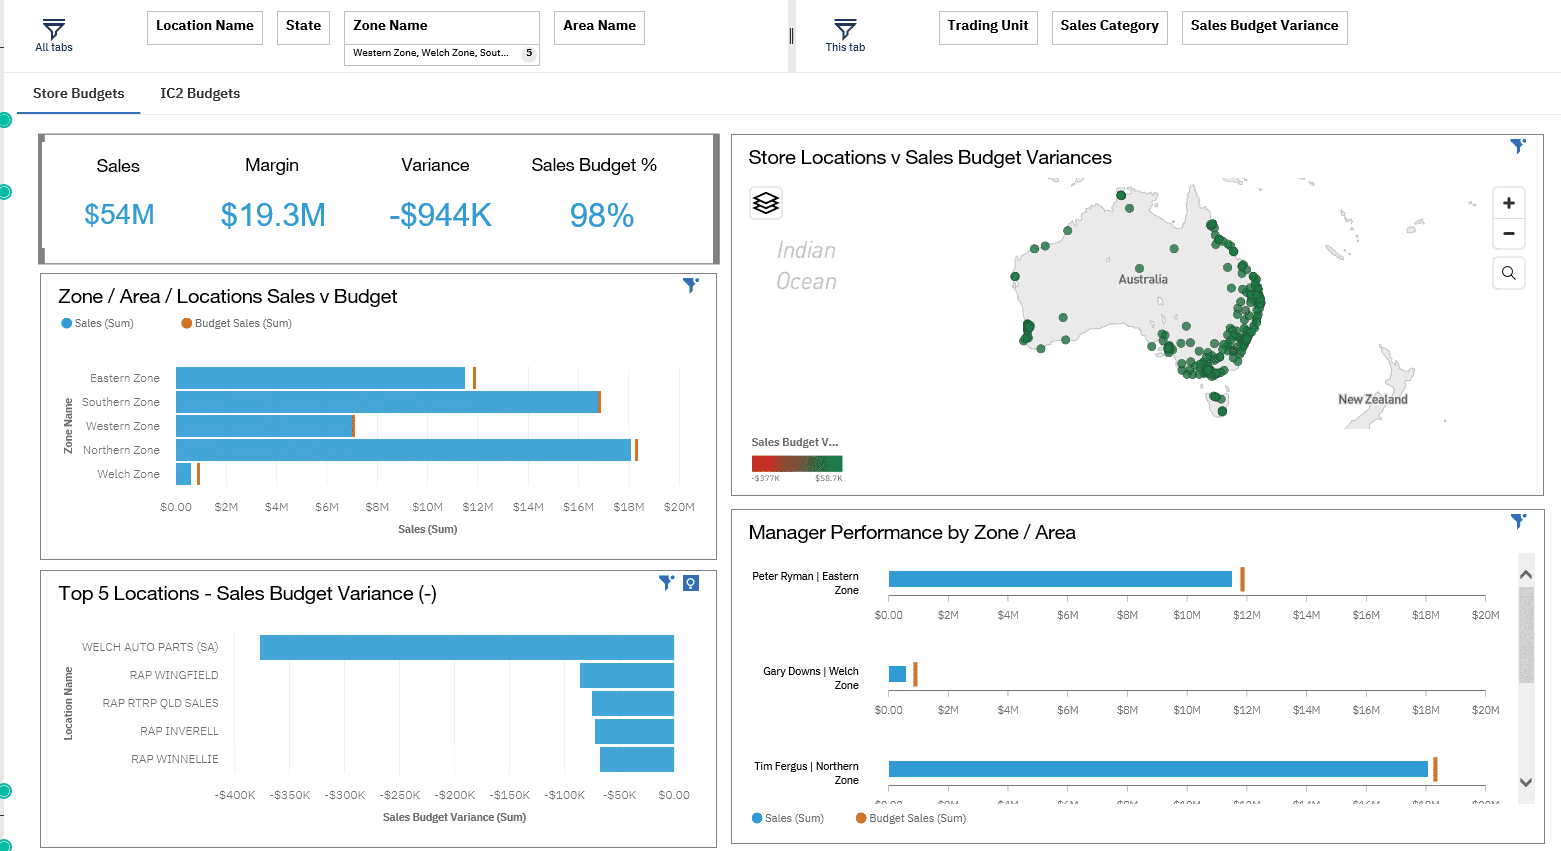
The use of visualisations/dashboards can be an effective way of highlighting key metrics and most reporting technologies have decent capabilities that enable quick, self-service reporting through an easy drag-and-drop interface.
Importantly, when using dashboards, it is also important to focus on a just a few key themes relevant to that user rather than trying to convey too much information. Dashboards can be split into multiple tabs if necessary.
4. Integrated reporting and planning
Reporting against benchmarks and business plans is critical. When the reporting system is separate from the planning system (generally using Excel or other non-performing tools), there is a large disconnect between the information flow between the two systems and the processes that take place around them.
Budgets and forecasts are often derived from using a feed of historical data as a baseline, and then those budgets and forecasts are finalised and fed back into the reporting system. This provides more opportunity for errors and data inaccuracies to creep into the process.
It is important to note that some reporting systems also feature powerful planning capabilities. By having an organisation’s budgeting and forecasting process integrated into their reporting system, they can more easily report on actuals alongside benchmarks and run scenario analyses that are immediately available to report against.
This leads to better and more efficient processes and information flow relating to planning and reporting disciplines within the organisation.
Having teams plan within the same tool as used for reporting also reduces the learning curve for business users and leads to greater engagement in planning processes – particularly when they can easily collaborate in real-time and follow workflows and task trackers to enhance the experience.
Furthermore, reporting and variance analysis is only meaningful if the underlying planning data is at the right level of granularity to support that variance analysis. For example, if you don’t plan at a price or volume level by product group or location, then understanding variances in sales data against plans will be difficult.
Key takeaways on reporting
Business wide reporting is often challenged by poor data quality and disparate systems, with an over reliance on manual processes that are inconsistent, prone to error and cannot be completed in a timely manner. Managing the flow of information to business users and adhering to information security policies also adds further complexity to the challenge.
Moreover, having a system (technology) that overcomes these reporting challenges and provides an integrated business planning capability should be a necessity, rather than a luxury, in today’s business environment.
Freeing up the finance team and line of business personnel from data consolidation, cleaning and transposition and enabling them to focus on more value-adding activities is also an important element to systemising these functions.
QMetrix works with multiple technologies for integrated reporting and planning and below are a few worthy of consideration:
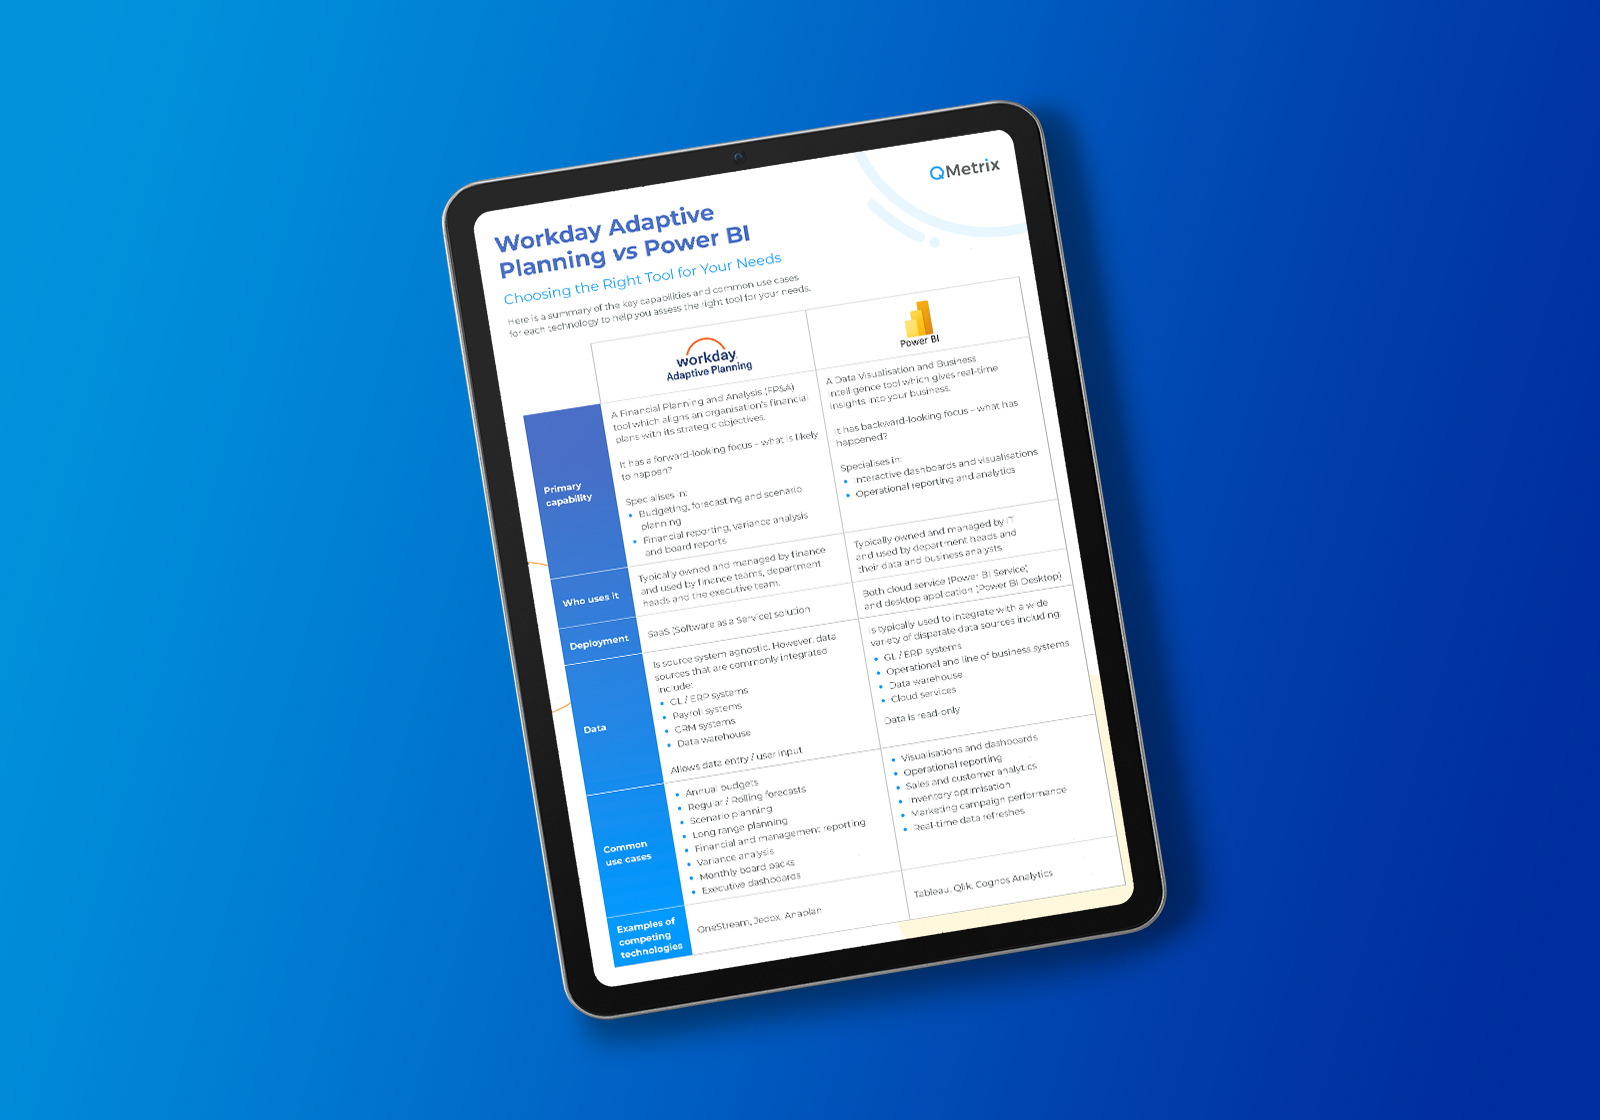
- Workday Adaptive Planning (formerly known as Adaptive Insights) is a cloud-only platform known for strong planning and office of finance reporting capabilities. Quick to implement and easy to use, it provides a fast and powerful tool to manage reporting and planning.
- IBM Cognos Analytics and Planning Analytics are highly customisable reporting, planning and forecasting applications available as on-premise or cloud deployment. They are end-to-end collaboration tools incorporating comprehensive analytics and reporting as well as a powerful planning capability.