
Successful scenario planning allows business leaders to react quickly and decisively to different business situations.
It is typically done through driver-based planning, which is an approach that focuses on identifying an organisation’s key factors that drive success, and then modelling business performance based on these key drivers.
We covered this topic at a User Group event exclusive to QMetrix Premium Care customers.
As part of the session our QMetrix consultants walked users through end-to-end driver-based planning in Workday Adaptive Planning. They demonstrated a multi-dimensional driver-based model coupled with a dashboard, for a hypothetical airline company – “QM Air”.
Below is a summary of the content we covered on driver-based planning:
![]()
Understanding your business
Before building a driver-based model, it is important to get an understanding of the business goals, what the business is trying to achieve and how these goals can be measured. This includes:
- Identifying qualitative business goals.
- Identifying quantitative Key Performance Indicators (KPIs) to help understand what metrics should be developed to measure goals.
Identifying the drivers, assumptions and results. These can be derived from the KPIs in the previous step.
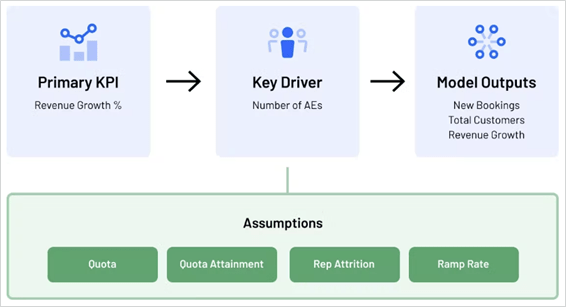
Source: https://www.mosaic.tech/post/driver-based-planning-forecasting

Driver-based planning for QM Air
To help conceptualise scenario planning, we used a hypothetical business – “QM Air”.
- QM Air is an airline carrier with headquarters in Mulgrave, Victoria.
- Charts domestic and international flights to all major cities.
- Recently purchased Workday Adaptive Planning and are looking to add driver-based models to their environment.
Here are some typical financial metrics that QM Air relies on to monitor its financial performance.
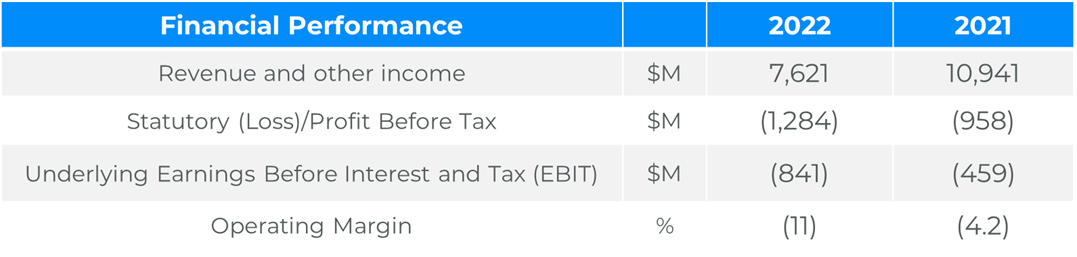
Table 1: Financial Performance
In contrast, these are some non-financial metrics that airlines typically use to measure performance:
- Available seat kilometers measures an airlines carrying capacity to generate revenue. It is the number of available seats on any given aircraft multiplied by the number of kilometers flown for all flights across all routes.
- Revenue Passenger Kilometers measures the air traffic for airbus and aircrafts using the formula: RPK = P*D, where P is the total of revenue paying passengers and D is the distance travelled in kilometers
- Revenue per available seat factor is commonly used to compare the efficiency of various airlines. It is obtained by dividing operating income by available seat miles (ASM). Generally, the higher the RASK, the more profitable the airline of the year.
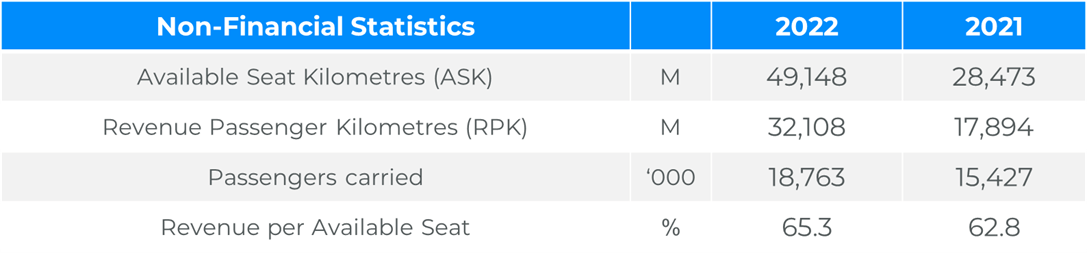
Table 2: Non-financial Statistics
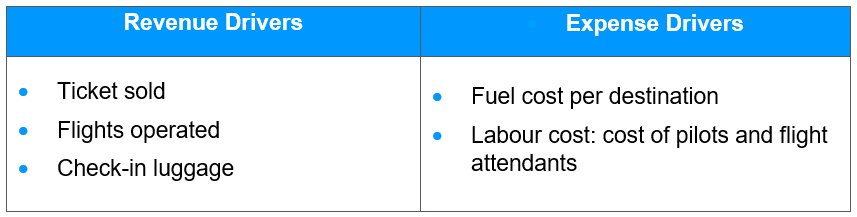
Now that the KPIs have been identified, the next step is to determine some of the key revenue and expense drivers.
Modelling in Workday Adaptive Planning
The model was built using a Cube Sheet. Cube sheets allow analysis across multiple dimensions, which brings more granularity to your planning models and hence greater accuracy.
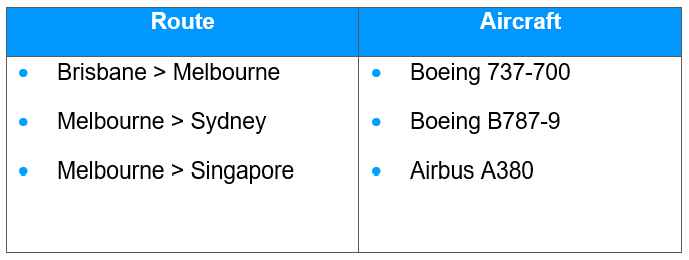
The Dimensions that we include in this model are:
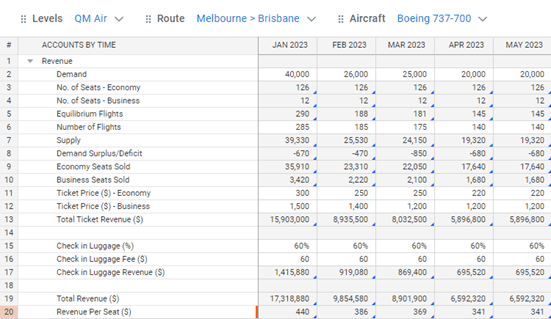
Revenue planning
After we identified our Revenue Drivers, it was then time to create the accounts and calculations that can be used as a means to measure revenue. Some of these include
- Equilibrium flights – which defines the number of flights that we need to operate to meet the demand
- Number of flights
- Demand surplus/deficit – analyses the mismatch between supply and demand.
- Tickets sold (for both Economy and Business)
- Total ticket revenue $
- Revenue per seat $
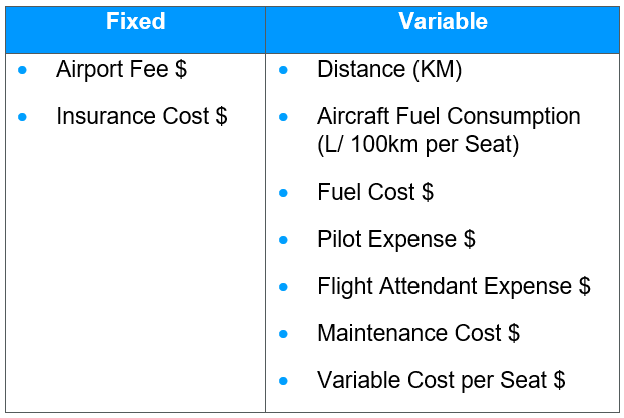
Expense planning
Then we identified the expense calculations according to our Expense Drivers. We can split these into variable and fixed costs.
Profit & Loss
As revenue and expenses were planned out, we then identified the following metrics:
- Profit/ Loss $
- Profit/ Loss per seat $
- Profit Margin %
Assumption
A set of assumption sheets were developed and drove the revenue and expense planning. For example, we had a Staffing Roster sheet that captured salaries for different roles of employees on the flight, which then automatically fed into the expense planning per Dimension. Other assumption sheets such as Fuel Assumption and Route Assumption were also used in similar fashion.
Scenario planning via version
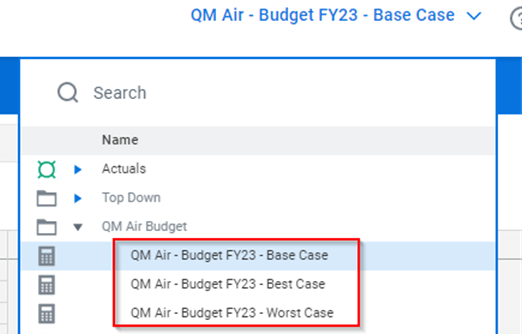
Scenario planning in Workday Adaptive Planning is typically done via a Version. Versions allow us to store one version of models’ data independent of another. For example, to put it in a scenario planning context, we can have:
- Budget FY23 – Base Case
- Budget FY23 – Best Case
- Budget FY23 – Worst Case
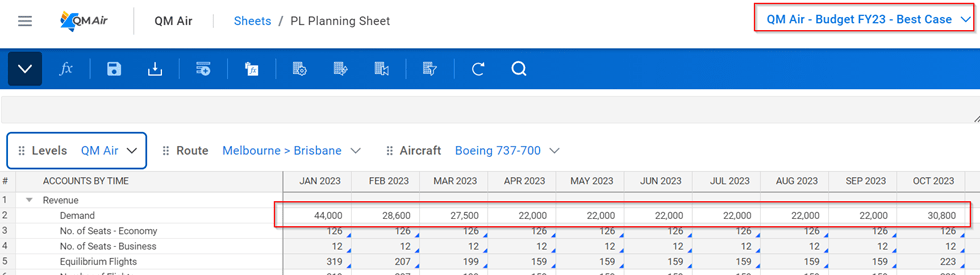
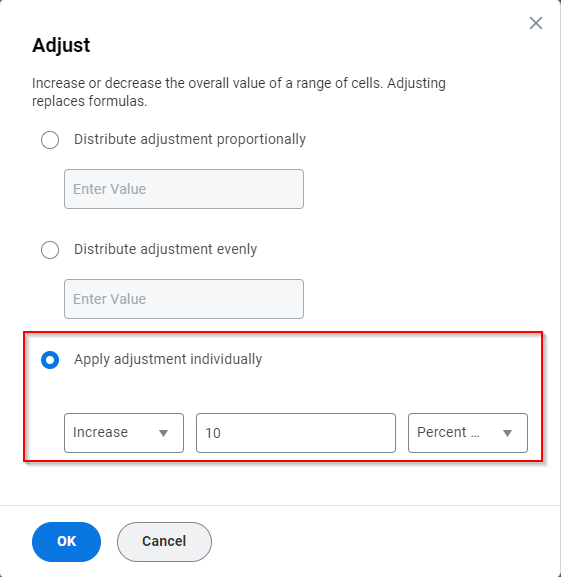
Once these versions are created, we can go back to the same planning model, select the best/worst case versions from the Version Selector, and adjust our planning parameters or assumptions accordingly. For example, we may expect in a good year, the monthly flight demand would have an increase of 10% in comparison to a standard year. In this case, we can change the version to “Best Case” from the version selector and increase the best case demand by 10%.
Other planning parameters and the associated assumption sheets can also be adjusted in a similar fashion.
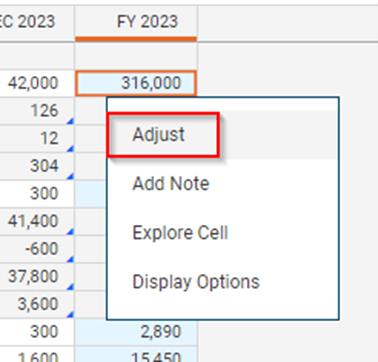
Some quick adaptive navigation tips can also be introduced here. For instance, if you intend to increase the monthly demand by 10%, you can simply: Right click the annual cell > Click into Adjust > Enter adjustment in the pop-up adjust window.
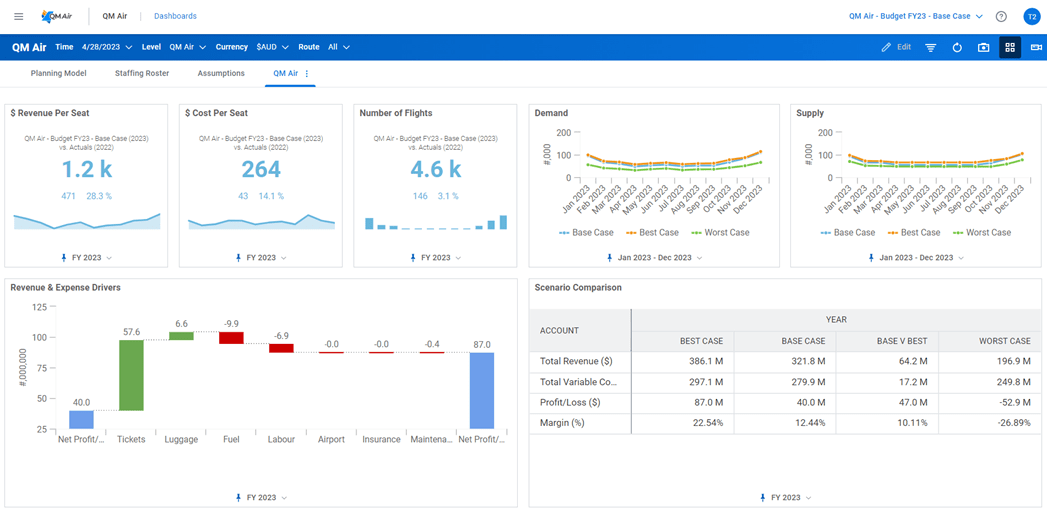
Planning dashboard
Dashboards can be leveraged to streamline the planning process in Workday Adaptive Planning by centralising the relevant planning sheets and visualisations. This allows the end user to input data across multiple sheets and analyse the data in the one location, seeing the visualisations update to reflect changes in the model instantly.
How to enhance your Workday Adaptive Planning models
Now we have created the planning models and evaluated the data via the dashboards, there may be ways to enhance your models in Workday Adaptive Planning.
Link existing driver-based models within Workday Adaptive Planning
If you have existing driver-based models in Workday Adaptive Planning, we encourage you to consider if these models can be leveraged in your current model.
A typical example could be linking depreciation expense from CAPEX planning sheet to Profit & Loss planning sheet. We can automate this process, which save your efforts from consolidating results from different modules, and make your planning less manual and more efficient.
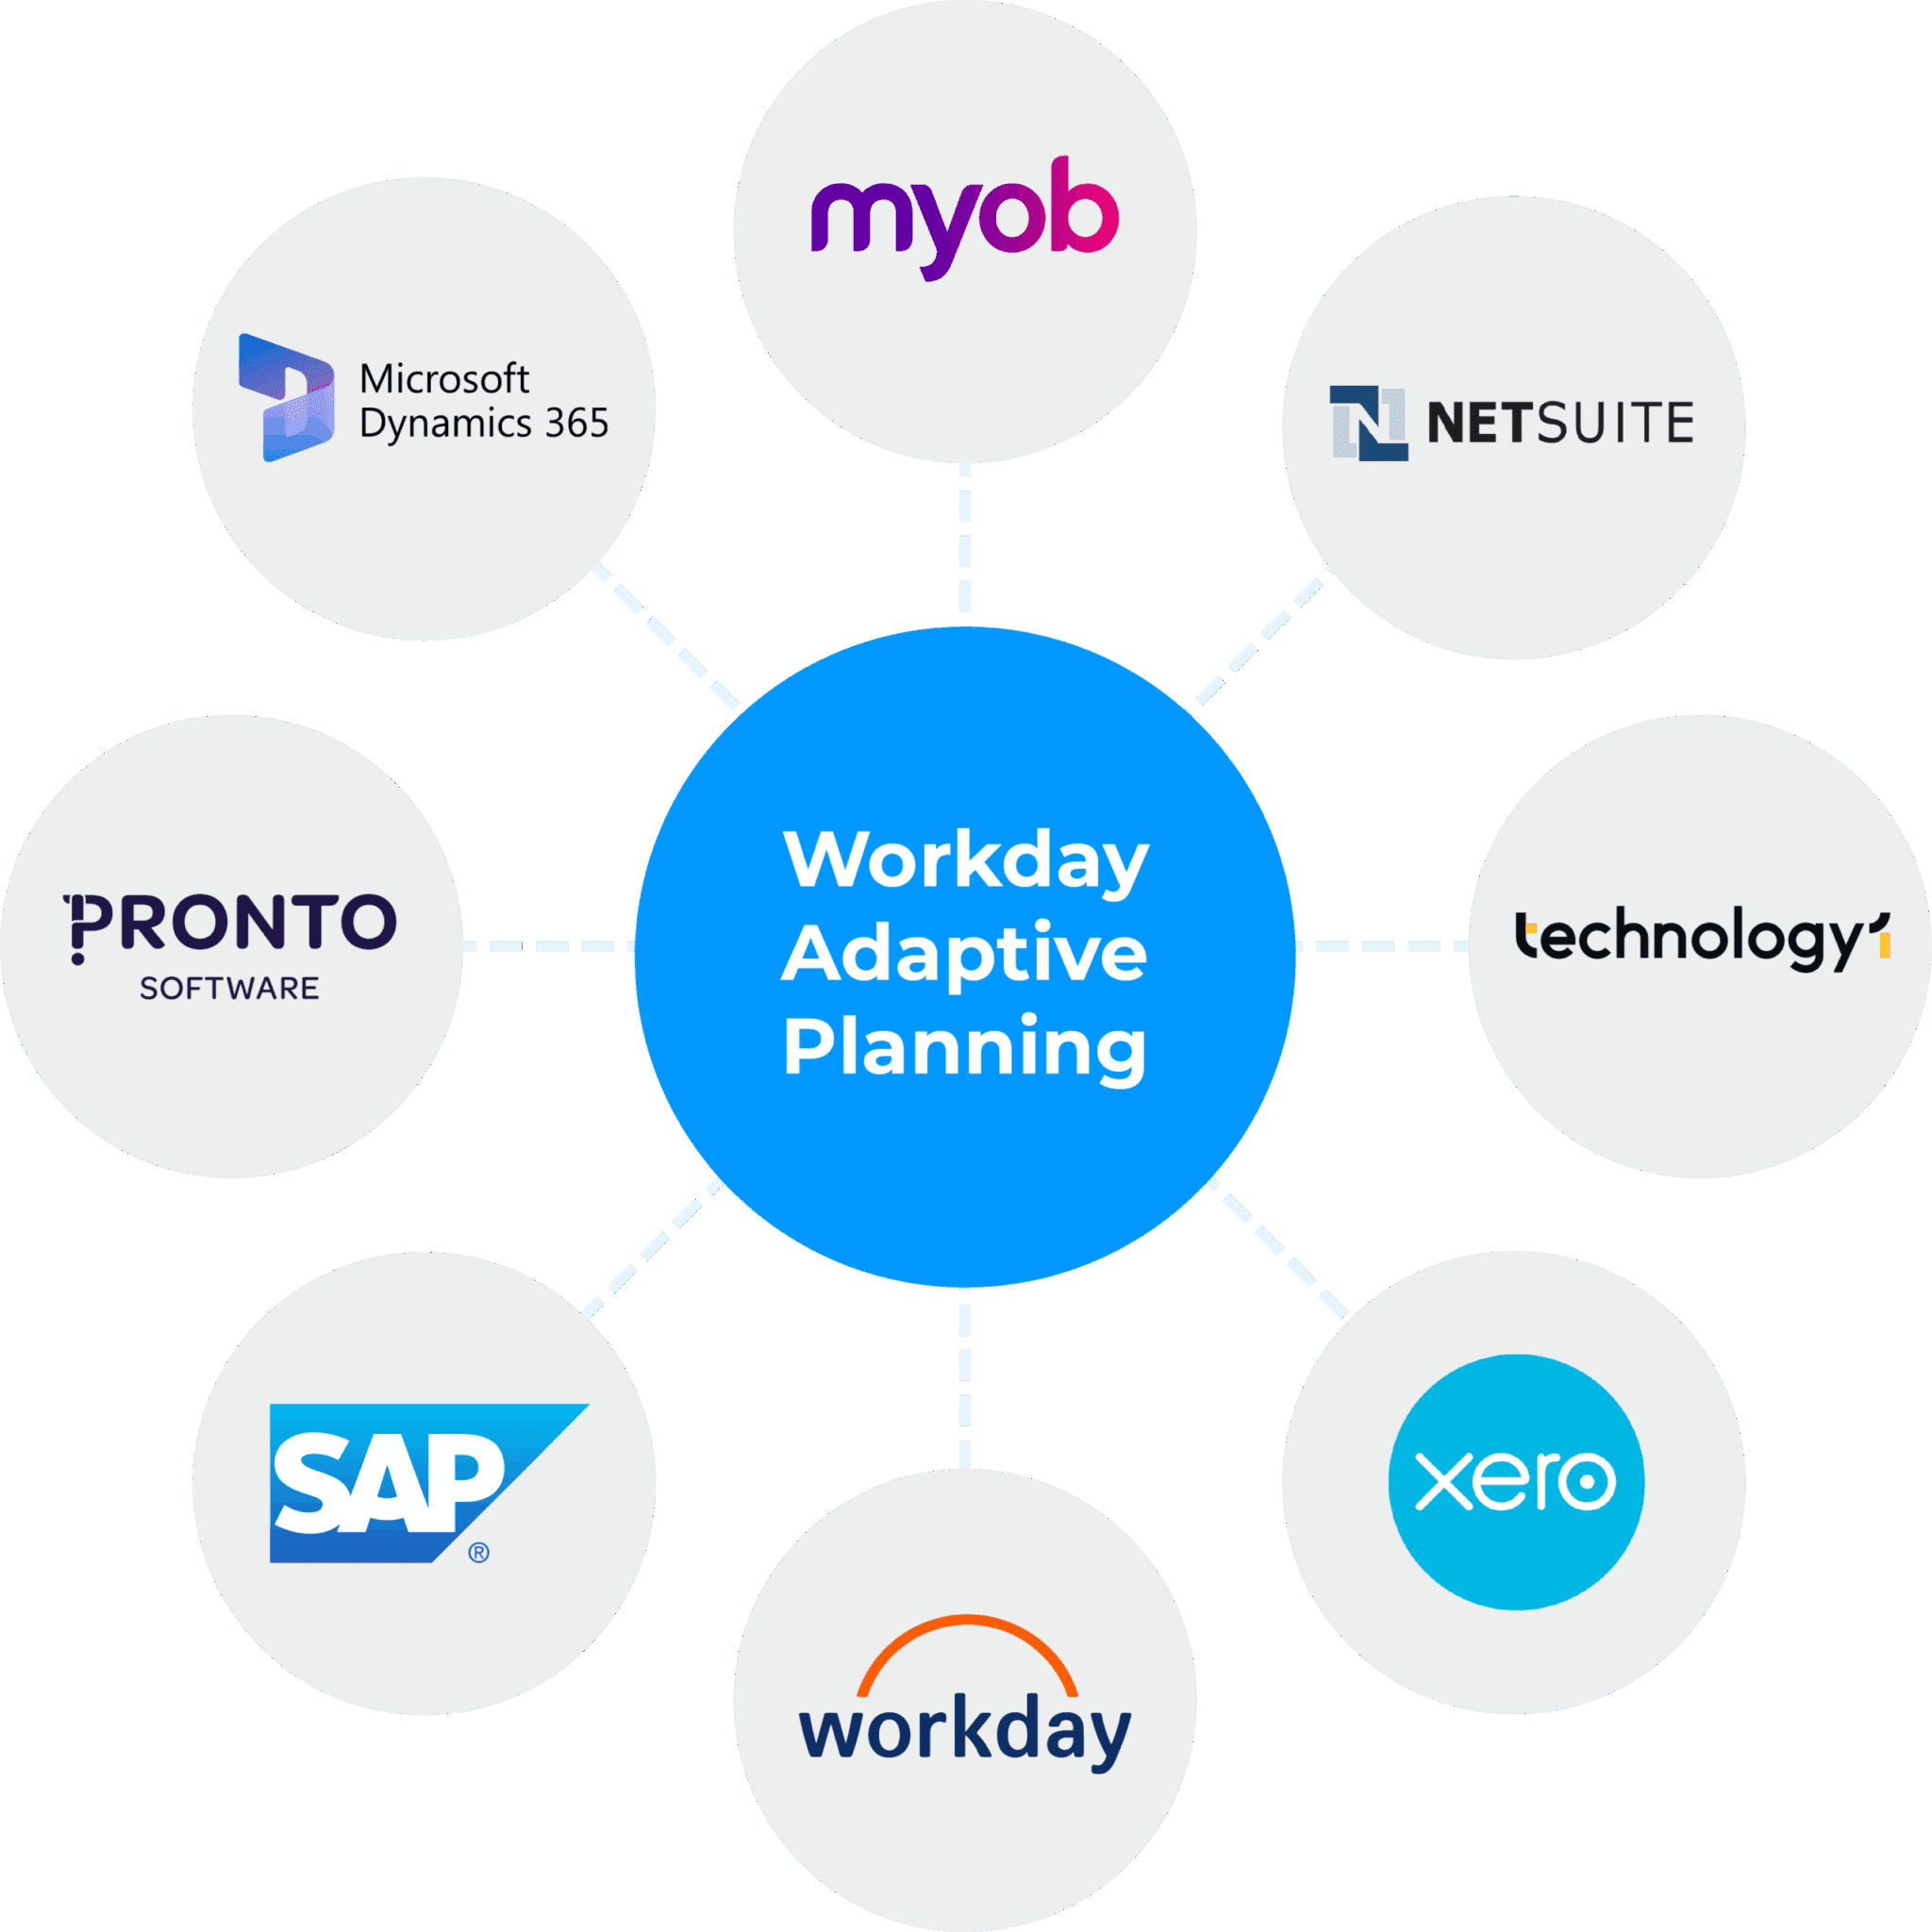
Integration with other source systems
We encourage you to consider linking Workday Adaptive Planning with other source systems via integration. This can improve the efficiency of your planning by regularly feeding in the most updated information that drives your models.
For instance, integrating Workday Adaptive Planning with your HR system to bring in actual salary data would help you make a more accurate assumption in payroll planning.
Those are our tips for driver-based planning in Workday Adaptive Planning. Be sure to check out our other articles for more tips or head over to the QMetrix YouTube channel for our library of Adaptive Planning video tutorials.
Get more Workday Adaptive Planning tips here
![]()
Workday Adaptive Planning Health Check Service
Is your Adaptive Planning instance not working for you? QMetrix provides a Health Check service to thoroughly review your instance, re-evaluate your goals and objectives, offer best practice solutions and update the Adaptive Planning solution to fit your business needs.
Find out more about the Health Check