The latest iteration of IBM Planning Analytics (previously known as TM1), has introduced a new Excel add-in for end users named IBM Planning Analytics for Excel (PAX” ).
PAX is intended to replace the aging TM1 Perspectives over time. However, it is important to point out that Perspectives remains a supported component of the IBM Planning Analytics suite and is still very much available for use.
PAX, like Perspectives, provides the ability for financial and non-financial professionals to interact with the TM1 cubes and dimensions to perform analysis, create ad-hoc reports and deliver highly customised reports. Further, users can write back to the database for budgeting and planning purposes.
This article will give you an understanding of the similarities and differences between the two.
The beauty of PAX is that it overcomes many of the nuances and frustrations of Perspectives while supporting Perspective formulas and reports – meaning you get the best of both worlds! These nuances include sharing of data and templates to non-TM1 users, and network performance. Moving to PAX should not be a hard decision, considering the below factors.
Key features of Planning Analytics for Excel (PAX)
Optimised for a Wide Area Network (WAN) environment
Performance over the WAN environment is optimised with Planning Analytics for Excel and eliminates the use of other tools such as Citrix or remote desktop to the server.
PAX leverages the REST API to retrieve and write data to the cubes. The REST API uses less bandwidth and makes it more suitable for over the internet.
Improved report sharing / No more DBRW formulas
Although Perspective formulas like DBRW and DBS are supported, PAX has introduced a new report type called ‘Quick Reports’. Quick Reports are view based, meaning there is no need for formulas to retrieve data from the TM1 cubes. Once a TM1 user refreshes the report, they can be easily sent to non-TM1 users without the need to copy values.
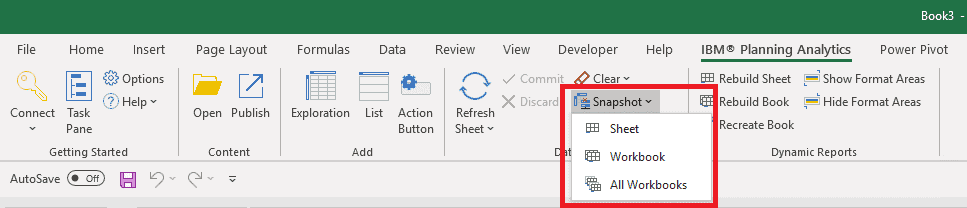
Further, handy features such as the ‘snapshot’ function allow the user to quickly convert a live report to a snapshot for auditing and version control.
Enhanced features
Improved data input functionality
In PAX you can directly input data in Exploration, quick report and cube viewer mode. Users with write access can write or copy and paste directly to the cube. Previously, copy and paste was not possible with DBRW formulas.
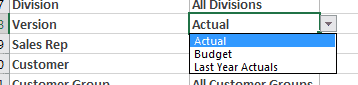
Automatic drop-down lists for dimensions
In PAX, an improved SUBNM function now comes with a drop-down list when you define a subset. It gives relevance to the report by limiting the number of elements and eliminate the user’s need to edit the SUBNM formula.
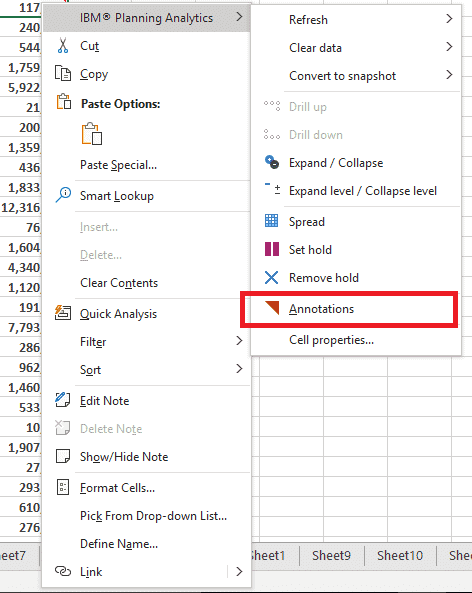
Ability to add comments and annotations in PAX
Now users can enter comments/annotations on the fly in Exploration, quick report and cube viewer mode. This feature means you do not have to maintain a separate cube or separate string measure in the same cube. The comments are also visible in IBM Planning Analytics Workspace.
New report functions
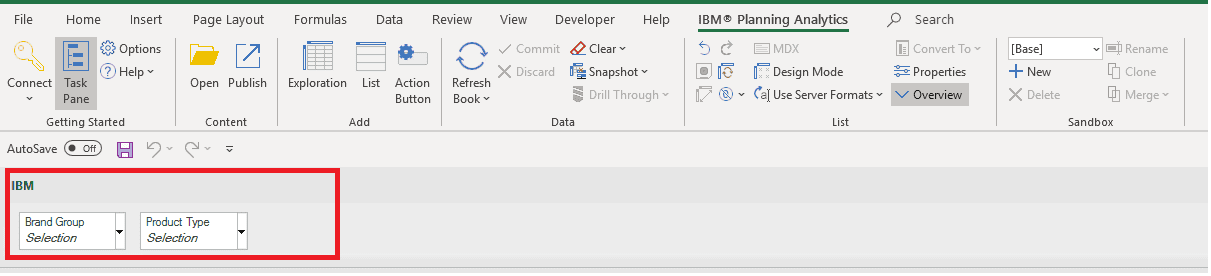
Exploration views
Similar to the cube viewer, Exploration view shows data in rows and columns. A significant difference is Exploration lets you explore the cubes in a familiar Excel environment.
Once you bring the dimensions across to the row, column and title area you can create private views for yourself and save them for future use. You can also control the row limit and formatting.
Use Exploration Views to compare and manipulate data so that you can better understand relationships between data. Exploration Views can be converted into Quick Report, Dynamic Report or Custom Report.

Quick Report
Quick Reports are live TM1 reports. However, they do not contain TM1 formula. You can create a Quick Report from an Exploration View after you finish your analysis and want to present data by using more advanced cell-based features from Microsoft Excel.
When you convert Exploration Views to Quick Report, system information for rows and columns are stored in name ranges. You can add more columns adjacent or inside the highlighted Quick Report area. Quick Reports can be shared with non-TM1 users, but they cannot refresh the sheet from the TM1 database.
Dynamic Report (previously Active Form)
In Perspectives these were called ‘Active Forms’. The underlying functionality is unchanged, although performance is improved in PAX. The Context area is placed above the report and formulas are used to apply the format automatically.
Similar to Quick Report data, in Dynamic Report data is shown in rows and columns. You can use the Convert To function from the Exploration view to create Dynamic Reports.
Custom Report
Similar to slice in Perspectives, the Custom Report joins multiple slices to create a versatile report. You can leverage Excel formatting in presenting the report, and you can develop an advanced report connecting multiple tabs.
List
New to PAX, the list shows the data in columns, and each column shows the members of a dimension set. The list has a single drop zone for columns to create a list.
The List is able to show detailed information from a data source (similar to SQL output format). The Overview area defines the data used on the List report.
The functions outlined above highlight the advantages of PAX over Perspectives. It has resolved quite a few pain points we all endured as Perspectives users, particularly the ability to share Excel reports with non-TM1/Planning Analytics users and improved network performance.
PAX is the future and it is where IBM is investing their development activities, so there will continue to be more functionality added to this area. This will ultimately mean an improved user experience making planning, reporting and analysis a lot easier, faster and more collaborative.
Looking for more on IBM Planning Analytics?