Learn the different ways users can build and structure their web reports using Workday Adaptive Planning.
The main reporting concepts covered include:
Watch the video, or continue reading below.
1. Rolling 12 month Report
We commonly see clients create web reports using a fixed group of months in the columns, with the anticipation to create a previous 12 month report.
The issue they face here is that each month they are then required to update the months reflected in the columns. Instead, we like to suggest building a rolling 12 month report. Continue on below if you are interested in trying this out for yourself!
In the following example, the last month shown on the report is previous month.
- Add any 12 consecutive months to your report (shift + click on the mouse to select), then drag these to the columns of your report
- Drag the latest month of the 12 months into the parameters
- Select the remaining 11 months and drop these on top of the Time parameter
- In the parameters section right click on time, select Properties then, in the Choices box, choose Previous Month.

- Ensure that you have added your accounts in the rows and your chosen version accordingly.
2. Timespan in Web Reports
The Timespan feature in web reports allows the report builder to control the date range and the periods shown on the report. Timespan also allows you to display the data broken down by month, quarter or year – or all of them at once!
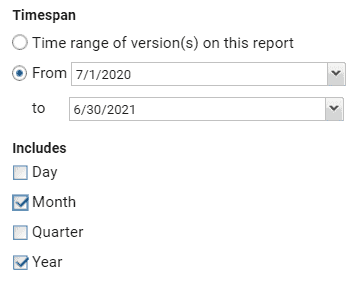
To add a timespan to a report, drag it across from the report elements and into the columns. Right click and select the properties. Here the date range can be specified and the level of detail (month, quarter or year) can be defined.

Note that both Month and Year has been selected. This means that the data that falls within the specified time range will be displayed in both month buckets and year buckets.

3. How to create a Previous Month YTD report
Another common request we get is how to create a previous month YTD report that is connected to the parameters.
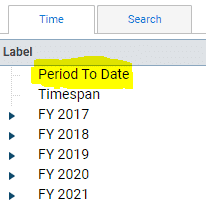
- Add in the previous month as well as Period to Date into the columns.
- Drag the month from the columns into the parameter section. Now drag Period to date and drop this on top of the month in the parameters, so that they are connected.
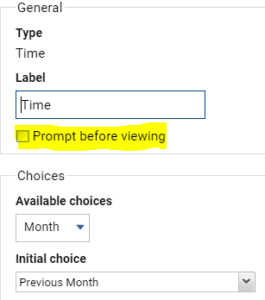
- Right click to select the properties of the time parameter and change the initial choice to Previous Month. Here you can also check the Prompt Before Viewing checkbox which will force the user to select the month each time prior to the report generating.


Looking for more Workday Adaptive Planning / Adaptive Insights best practice tips?


