As a business intelligence and analytics tool, IBM Cognos Analytics continues to retain its spot as one of the industry leaders. It delivers constant improvements to the software through frequent releases, with new features and fixes that improve its functionality and user experience.
With each release of Cognos, we update this page so you can check back and evaluate how to make each release work for your business. You will:
- See how Cognos has progressed
- Get a breakdown of features and functionality with each release
- Determine what can be implemented for your organisation
The latest release is right below, but if you want to jump to other releases:
Are you still on the old version of Cognos? Here is our honest opinion on whether you should upgrade to Cognos Analytics (11.1 and beyond). Read about the changes to features and functions, and our verdict.
11.1.7 – What’s new in Cognos, July 2020
In this latest release, Cognos Analytics 11.1.7 has provided a good mix of bug fixes, enhancements, and new features.
Some of the key changes that caught my attention this time round included:
- Additional customisations of Visualisations (axis, labels, title, baseline options, Legends, and Logarithmic scales) to allow greater flexibility.
- Disabling the On-Demand toolbar when you want to hide options from users.
- When creating data sets, you can now have access to the query explorer/editor (including reusing an existing report and its queries in the data set).
- Ability to attach reporting content to emails to improve collaboration and sharing capabilities.
Also, it is worth mentioning that IBM continues to standardise their platforms with implementing additional Carbon Design practices, such as new icons and updates to fonts and colours.
The full release notes can be found here.
Let us focus on the features that I thought was more interesting than others in this release.
Dashboards – Making Visualisations easier to use
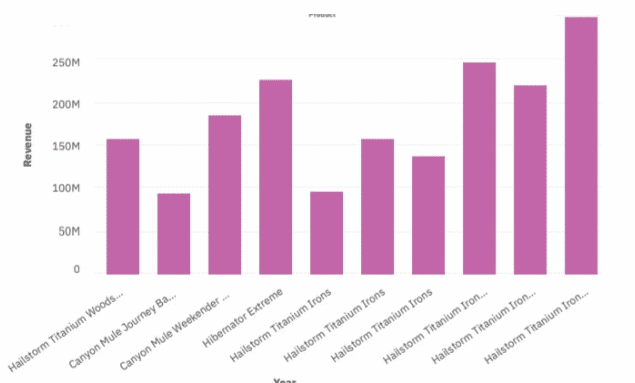
In the past or even recent releases, legibility on visualisations has always been an area of improvement. As of this version, the categorical axis labels were improved. The padding and angle were changed to improve the legibility.
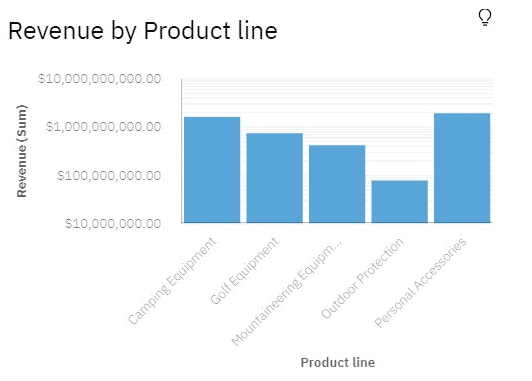
Another issue that I have found with visualisations in general were their scaling capabilities. With this release, you can now use Logarithmic scales when the data you are displaying is much less or much more than the rest of the data of when or when the percentage differences between values are important.
What about axis and title options? There are two new options in this release.
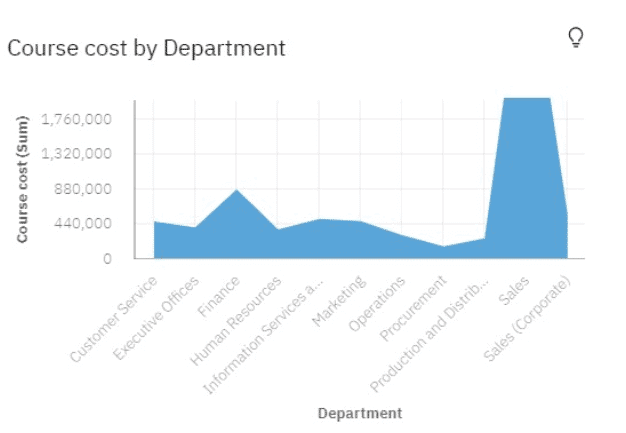
- New axis options allow you to change the value axis tick interval in some visualisations. For example, you can set the minimum and maximum value of the value axis with the Value axis minimum / maximum value option.
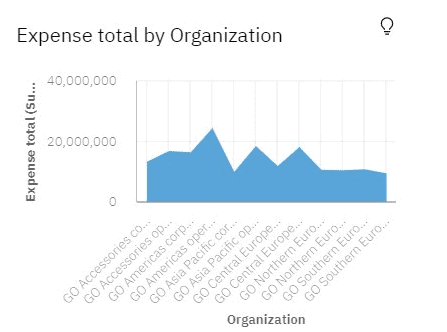
- New title options to allow further customisation to the visualisations.
- Smart title – Data is used to display the title.
- Custom title – You can specify the title.
- No title
Reporting – Keeping UI and Visualisations consistent and ease of querying
As mentioned in the last few releases, IBM is committed in making the look and feel of their tools consistent. Although the Dashboarding and Reporting components of IBM Cognos are two separate offerings, you will continue to see future changes consistently implemented in both.
To start off with reporting, I would like to start with the ability to add a baseline to a visualisation. Either horizontal or vertical lines that cut through the chart to indicate major divisions in the data.
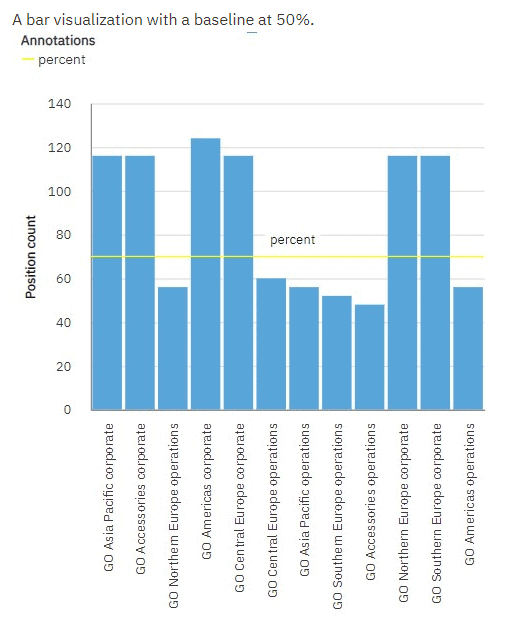
In addition, like the Dashboards, you have the same ability to use the enhanced categorical axis labels, title, and Logarithmic scale options.
Query Explorer changes
Lastly, I want to highlight the data set improvements. The ability to use the query explorer when creating data sets is a huge improvement in my opinion. This allows greater flexibility in managing and changing your queries. Moreover, you can reuse an existing report and its queries in the data set.
You can also perform query operations with properties, manage advanced filters and parameters, review the generated SQL, and validate and rename queries.

Administration – Improving Collaboration and Sharing Capabilities
Whether you have built a great report or dashboard, there is not much point if the audience is unaware of it.
In Cognos Analytics 11.1.7, five new capabilities were introduced, and one existing capability was changed.
The Email capability allows a user to send an email when scheduling or sharing content. The additional four new functions are listed below:
- Email Delivery Option
- Include link in email
- Share using email
- Type in external email
The Attach Outputs capability allows a user to attach outputs in an email when setting a schedule, running a report in the background, or setting job steps.
"With Cognos Analytics we have delivered reporting automation and improved productivity. The way we use our data is much more efficient." – Phil Gilbert, General Manager Finance. Learn how GPC leveraged Cognos to improve reporting for over 650+ users. Read the case study.
11.1.6 – What’s new in Cognos, April 2020
In this latest release, you can expect some great features to enhance the overall user experience. Some of these enhancements and changes include a brand-new way to learn the system (Cognitive Learn Pane), making the Cognos UI (including Dashboards and Reports) more consistent and user-friendly, and improvements to its AI and Advanced Analytic capabilities.
The full release notes can be found here.
Let us focus on the features that I thought were more interesting than others in this release.
Cognitive Learn pane
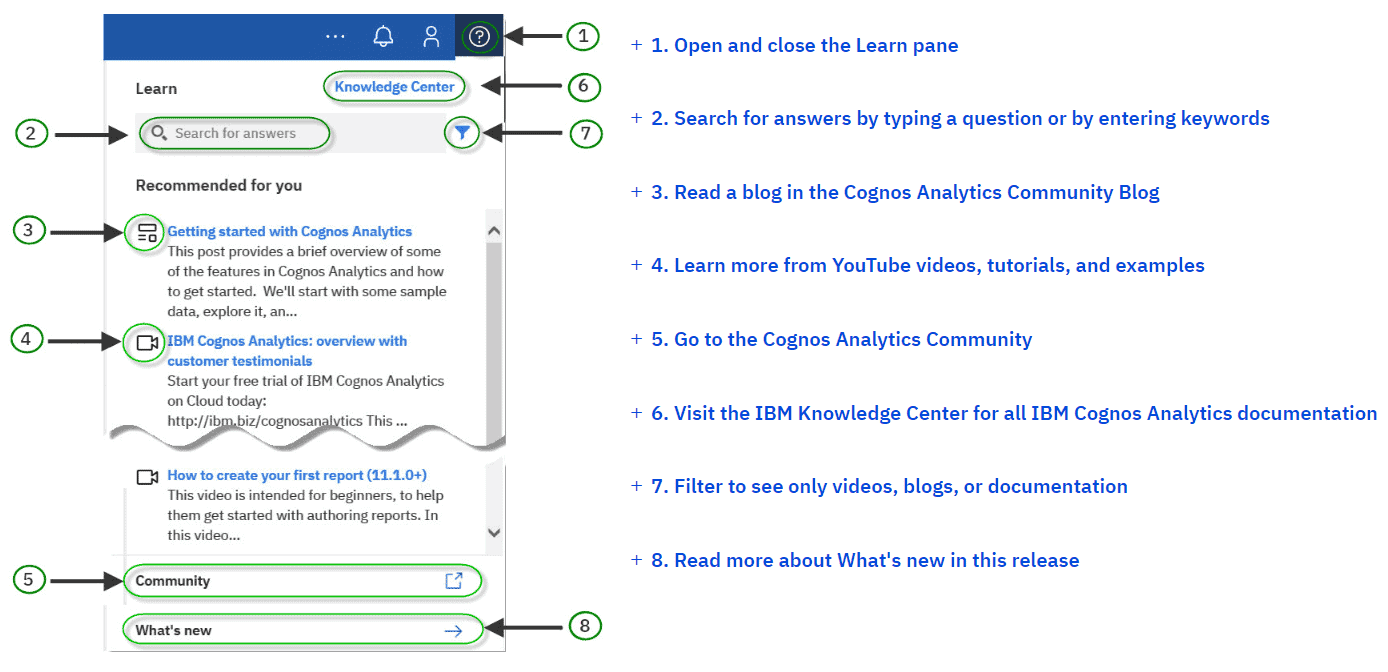
This is a fancy name for a help system. When it comes to finding out something about the Cognos toolset or any type of software tool for that matter, it can be often be a painful process to find something you need or relevant quickly. As a result, IBM has introduced this new help feature to improve how we learn. And I quite like it.
Located on the top-right location like before, the new ‘Learn’ pane now tailors your question to where you are working and finds only the answers that are relevant to you.
Whether you are searching or clicking on the learn/help ‘?’ icon on the toolbar, the help system understands what feature you are currently using and will suggest any related content (eg, knowledge articles, YouTube videos, and IBM community content) as a result.
For example, if you are using the Dashboard UI and its visualisations, the help system will return all relevant results based on Dashboard and visualisations. Pretty cool, huh?
User Interface Improvements – New Carbon Design Icons
We all know that the IBM product family does not just consist of Cognos. Keeping the IBM products (especially IBM Planning Analytics) consistent in look and feel is heavily evident in this release; IBM continues to apply the Carbon Design System to Cognos Analytics.
“The adoption of Carbon Design icons provides a consistent user experience across IBM products’’ – IBM
As a result, several icons and typefaces have been changed. Personally, I think the changes give the Cognos UI a fresher look, and consistency is the key point here.
Dashboard Changes – UI and Design
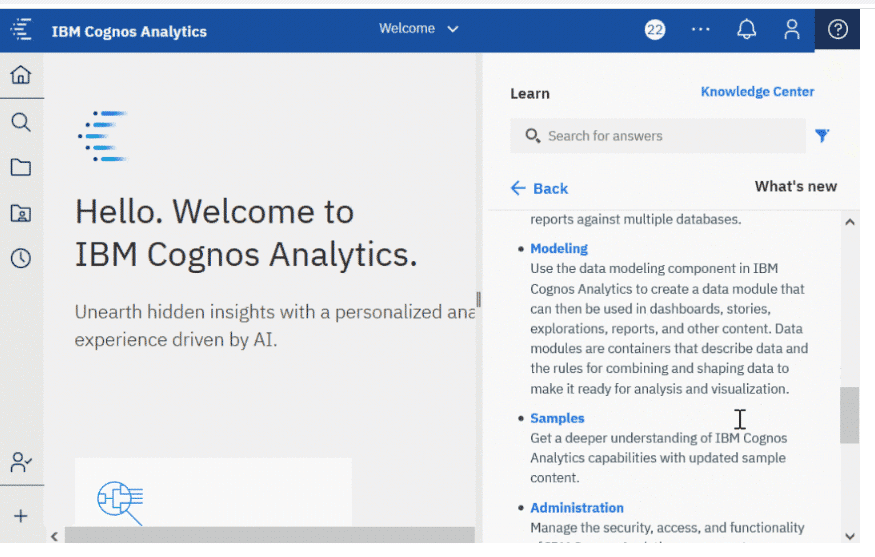
In past versions of the Dashboards, at times, it can be quite frustrating when the Dashboard menus and layouts are not exactly consistent or easy to use. However, in this version, IBM has made some nice improvements to make the user experience much more welcoming.
Crosstabs (expand/collapse – OLAP only)
You can now expand crosstab hierarchies to display the nested children. This is very handy when dealing with dimensional data. It also applies to Planning Analytics, Power Cubes and Microsoft Cubes.
Field Pane
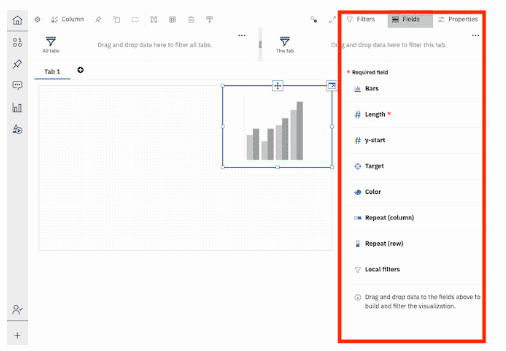
It is now easier to navigate visualisations to make changes; you can add a column to each mandatory field in the Fields Pane. Additionally, maximising the screen space for this feature was a nice touch.
Visualisation toolbar is docked at the top of a dashboard
Another smart feature is the docking of the Visualisation toolbar. The toolbar for visualisations is now at the top of your dashboard and is docked there by default. Although it can be undocked, most users probably want it docked somewhere at the top for easy access.
Depending on what you select on the dashboard, the Toolbar icons will be shown accordingly. For example, if you click a table visualisation on the dashboard, the toolbar appears with the icons that you can use for tables. Again, this makes things easier than before.

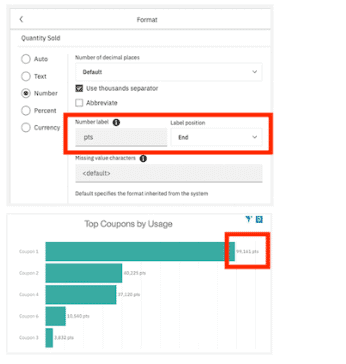
Customising unit Labels
Finally, you can have a custom label on your visualisation. You can define a custom label on a measure. For example, if you have a bar chart that shows numbers, you can specify a label for the numbers, such as ‘pts’ to indicate that the numbers represent points.
You can also specify the position of the label, such as End.
Focus Mode
Focus mode is now changed for dashboard consumers (not just in edit mode). Use focus mode to maximise the size of a visualisation to quickly review chart content. Basically, it works as a ‘full screen’ button for an individual visualisation.
For example, if you want to take a closer look at a chart on a dashboard, expand the visualisation to make it larger. It is very easy – and useful.
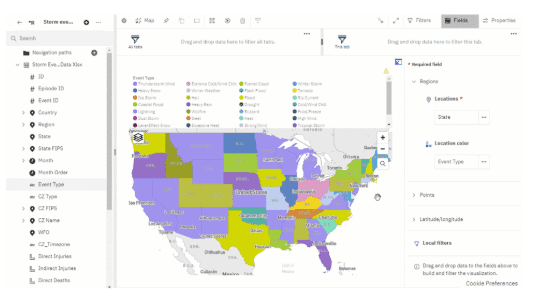
Support for categorical colouring in a map visualisation
As of this release, map visualisations now support categorical colouring. This is all about giving more control to the user.
Reporting changes
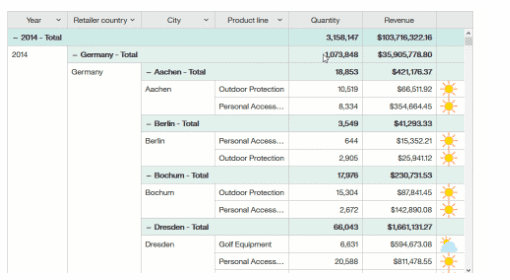
There have not been many changes at all for reporting in this release. However, a new type of data container “Data table” was introduced in this version.
It is like a list object (showing rows/columns) but allows interactivity, as well as the ability to expand/collapse and apply filtering functions to columns.
Unlike in lists, the data is rendered on the browser side, so the data in the data tables is displayed very quickly. This is a very handy function to have.
11.1.5 – What’s new, December 2019
Like the previous release of Cognos Analytics 11.1.4, you can expect some key enhancements and new features in this latest release.
Although not a major release, there are several changes I would like to focus on. These include enhancements to Dashboards, Explorations, Reporting and Modelling. The full release notes can be found here.
Dashboards
Cognos Analytics 11.1.5 adds more improvements for dashboard users.
Display Members in a Data Tree – expand hierarchies to display the members in the data tree. In the Selected sources panel, members are organised into a data tree structure, with parent and child members.
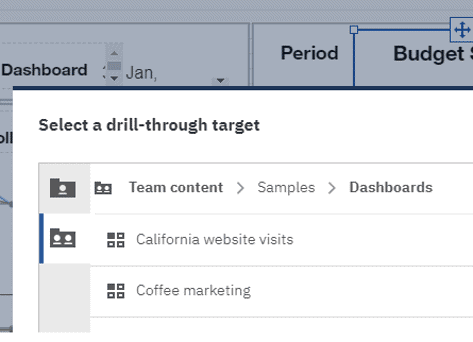
Drill Through from Dashboard to Dashboard – drill-through definitions from a dashboard to another dashboard. The values you select to drill through from are passed as global filters to the target dashboard.
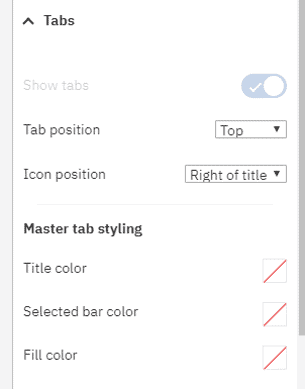
Customise Tabs – customise tab styling for individual tabs or for all the tabs in your dashboard. Move the tabs to the top, left, bottom, or right of your dashboard and add icons to your tabs.
Show or Hide Rows in a Crosstab Visualisation – show or hide individual rows and columns in a crosstab while the Summary rows maintain their value.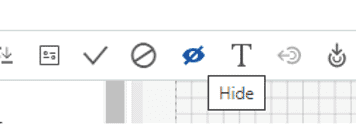
Customise Missing Values – customise how missing values are displayed in your visualisations.
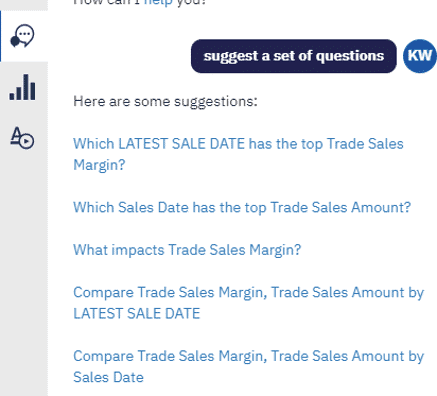
Assistant-suggested questions based on context – ask the Assistant to suggest a set of questions.

New URL for downloading the custom visualisation command line tools – location for downloading the custom visualisations command line tools has changed.
Custom visualisations support nested and hierarchical categories – support hierarchical categories. You can use hierarchical categories by using the Class Segment in your custom visualisation.
Enhancement to Forecasting – enhanced forecasting algorithms were evaluated on over 2,000 data sets and there was a 20% increase in accuracy, compared to the previous algorithms. In addition to an increase in accuracy, the confidence intervals are now more reliable than in the previous release. For more information on the forecasting enhancements click here.
Value axis ticks interval – with the option of Value axis tick interval you can set the interval on the value axis.
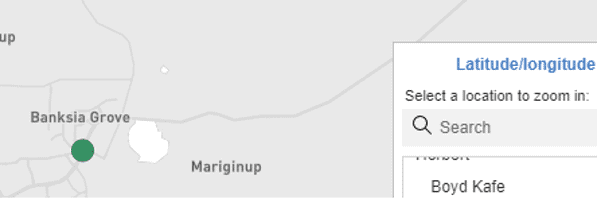
Search and Zooming in on Maps – when you use a map in a dashboard, you can search and automatically zoom into items that are matched on your maps. For example, you can zoom into small regions that are spread over a large area.
Refreshing a custom visualisation in preview mode in Dashboard – you can now refresh the custom visualisation in a dashboard in preview mode.
Explorations
Moving over let’s look at changes in the Exploration module.
Enhancement to Forecasting – in summary, the algorithms were improved by 20% as mentioned in Dashboards.
Perform multiple requests concurrently – as you interact with the relationship diagram, you can perform multiple requests concurrently. Each request that you submit is now managed and cached independently.
Display members in the data tree – expand hierarchies to display the members in the data tree. In the Selected sources panel, members are organised into a data tree structure, with parent and child members. Now you can show or hide all levels of the hierarchy, including the child members.
Reporting
There are several useful features added to the reporting module.
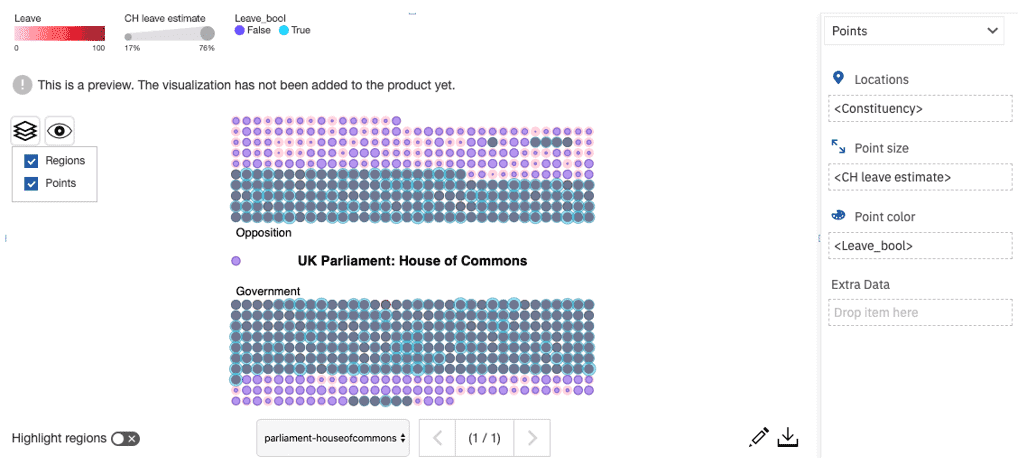
Schematics – these are visualisations that can map data directly onto an arbitrary graphic representation. Schematics can, for example be floor plans, seating arrangements, mechanical drawings, or schematic geographical representations.
A schematic is a library of similar images, like seating plans or stadium layouts, that use similar keys and that are conceptually bundled together to provide some organisation.
New URL for downloading the custom visualisation command line tools – the location for downloading the custom visualisations command line tools has changed.
Custom Visualisations Now Support Nested and Hierarchies – custom visualisations now support hierarchical categories. You can use hierarchical categories by using the Class Segment in your custom visualisation.
Search and Zooming in on Maps – when you use a map in a report, you can search and automatically zoom into items that are matched on your maps. For example, you can zoom into small regions that are spread over a large area.
Legends are more compact in PDF and reports – if you use 11.1 visualisations in a report, then your PDF output and reports have a compact legend like the HTML output that was introduced in IBM Cognos Analytics 11.1.4.
Modelling
Some interesting changes to modelling in Cognos 11.1.5 include:
Members in the Data Tree – the data module tree shows the content of relational and dimensional sources. In both relational and dimensional sources, members are shown in the data tree.
Custom Tables – custom tables are created from tables that exist in the data module. The term “custom table” is new in this release, but the functionality to create new tables in data modules existed in previous versions of Cognos Analytics.
Showing the query information – modelers can view the query information (SQL) for tables and relationships.
Generating the query SQL – can specify how Cognos Analytics generates the SQL that retrieves data from tables.
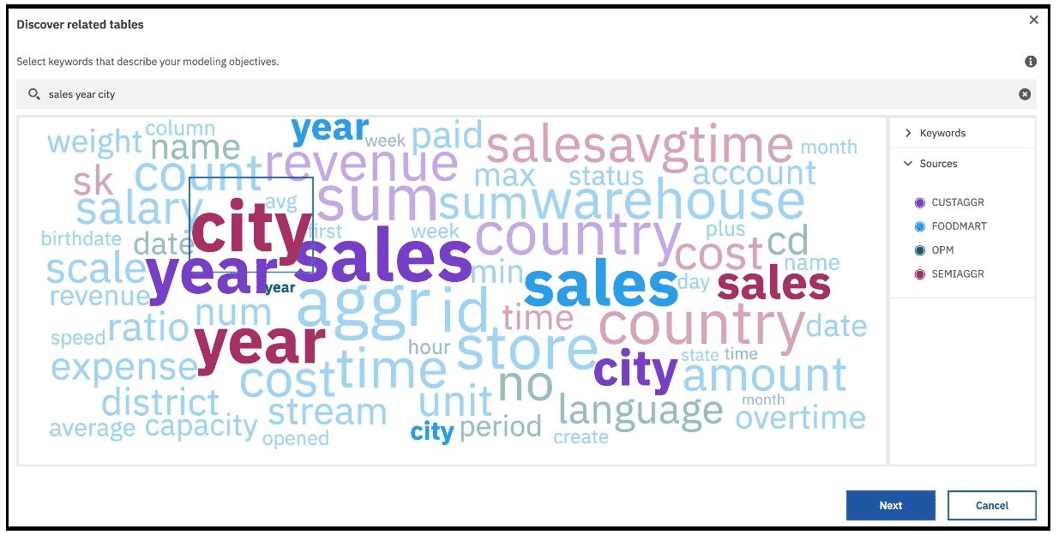
Redesigned user experience for intent modelling – when adding tables to a data module, you can engage the system to suggest the most appropriate tables for your module.
The selection of tables is based on keywords that you select. Starting with this release, the keywords are visualised using an interactive word cloud, as shown in the following example:
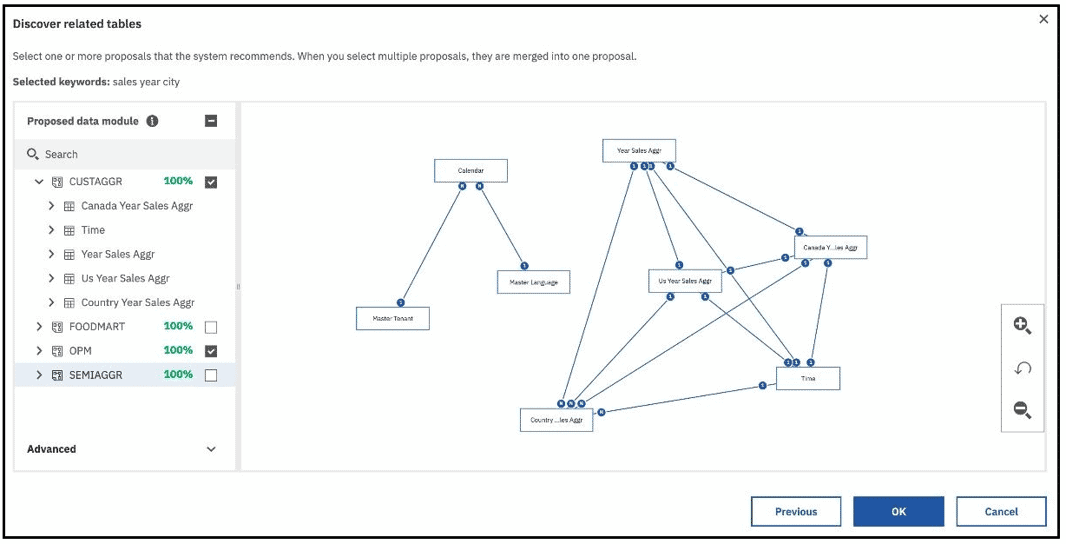
The user interface for creating a data module proposal includes a confidence score that reflects, in percentages, the predicted ability of the proposal to fulfill your modelling objective.
Package enrichment enhancements – the user interface for package enrichment was redesigned.
11.1.4 – What’s new, October 2019
Hot off the press! In the latest release of Cognos Analytics 11.1.4, you can expect some exciting new features and changes. Visualisation is a clear winner in this release which I will focus on in this post. The full release notes can be found here.
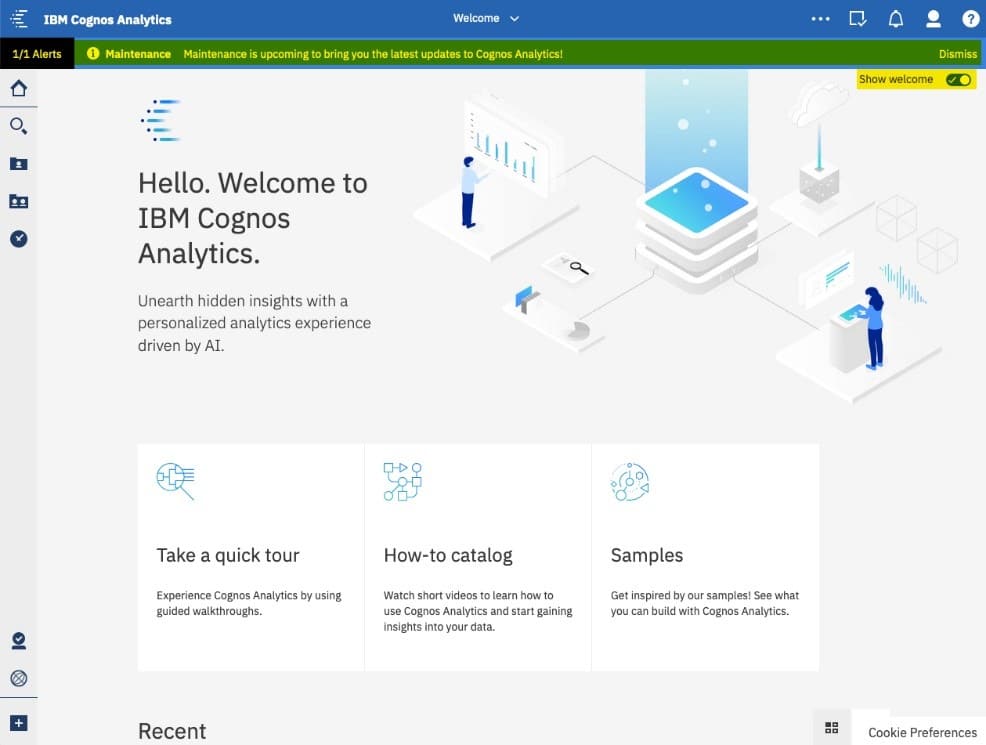
Redesigned welcome page
An updated user interface introduces an alert (including important maintenance announcements and information on new/changed features) banner and a new welcome page.
It is all about making the user experience as easy and informative as possible with quick access to walking through tours, videos and embedded samples.
Dashboard and visualisations
Dashboard and visualisations, in general, receive a nice upgrade in many ways.
Have you ever being in a situation where you wished you could have easily created a custom visualisation for your business need? Now you can! Developers can create and test custom visualisations (interactive viewer only as HTML output) locally, before making them available to other users.
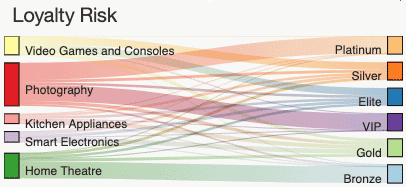
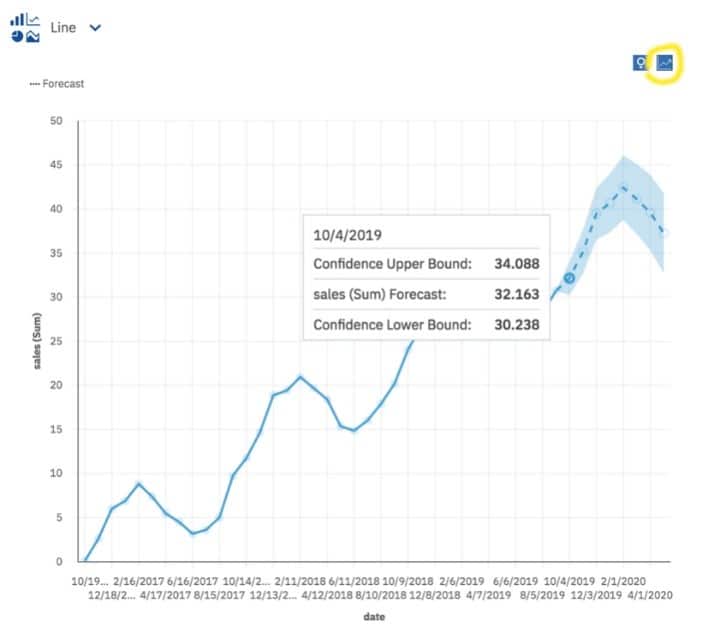
Forecasting is an automated set of tools for modeling time-dependent data. It leverages a popular class of exponential smoothing models to discover and model trend, seasonality and time dependence in the observed data. Automated model selection and tuning makes forecasting easy to use for all users.
Visualisations get a boost to the legends as well. Now, you have a more compact design which uses the space more efficiently. The default position is now above the visualisation. You can also adjust the legend by dragging the splitter in the visualisation.

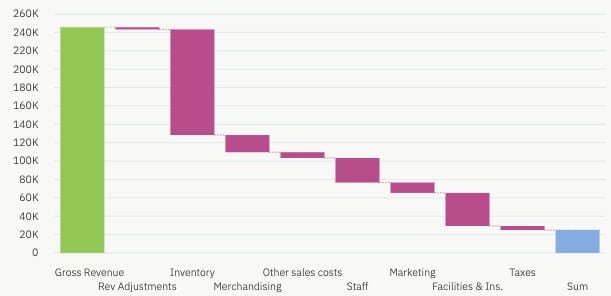
Waterfall visualisation is ‘finally’ available in the dashboard.
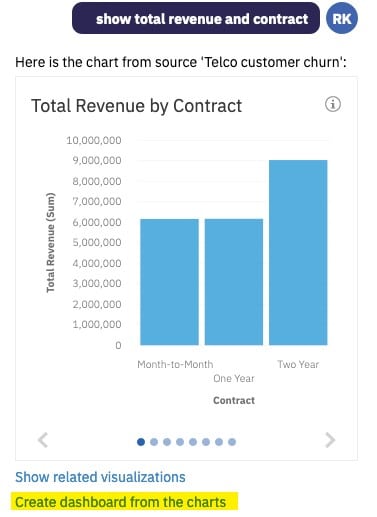
Context-based dashboard generation allows you to create a dashboard based on column data from your most recently generated charts.
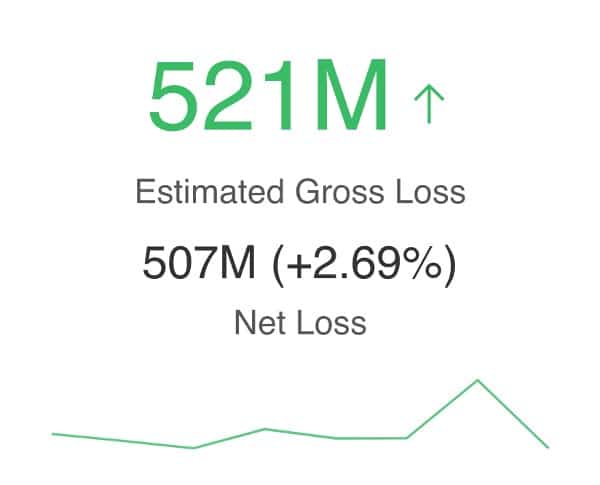
KPI visualisation is available in the dashboard. One word to describe this one is ‘wow’. Personally, I have been looking for something like this in the dashboard since the first version. Some of my clients would be very happy about this. In one visualisation, you can have two related measures (base value vs target), visual indicator (up/down arrows with colours), percentage change and sparkline in one space.
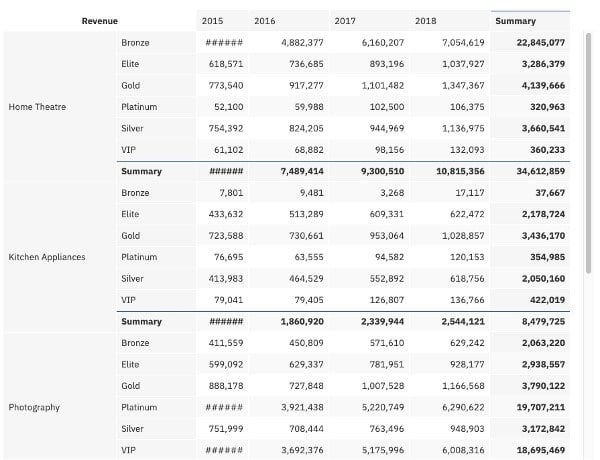
Improvements to crosstab and table formatting. Some new enhancements to crosstabs and tables include resizing column width and row height, formatting the cells in crosstab/table (separate from summary cells), text formatting, wrapping text on header rows and columns and dragging data from the ‘Selected sources’ pane onto a crosstab or table.
11.1.3 – What’s new, July 2019
In the latest release of Cognos Analytics 11.1.3, there are several hot new features that might surprise you (in a good way!). The full release notes can be found here.
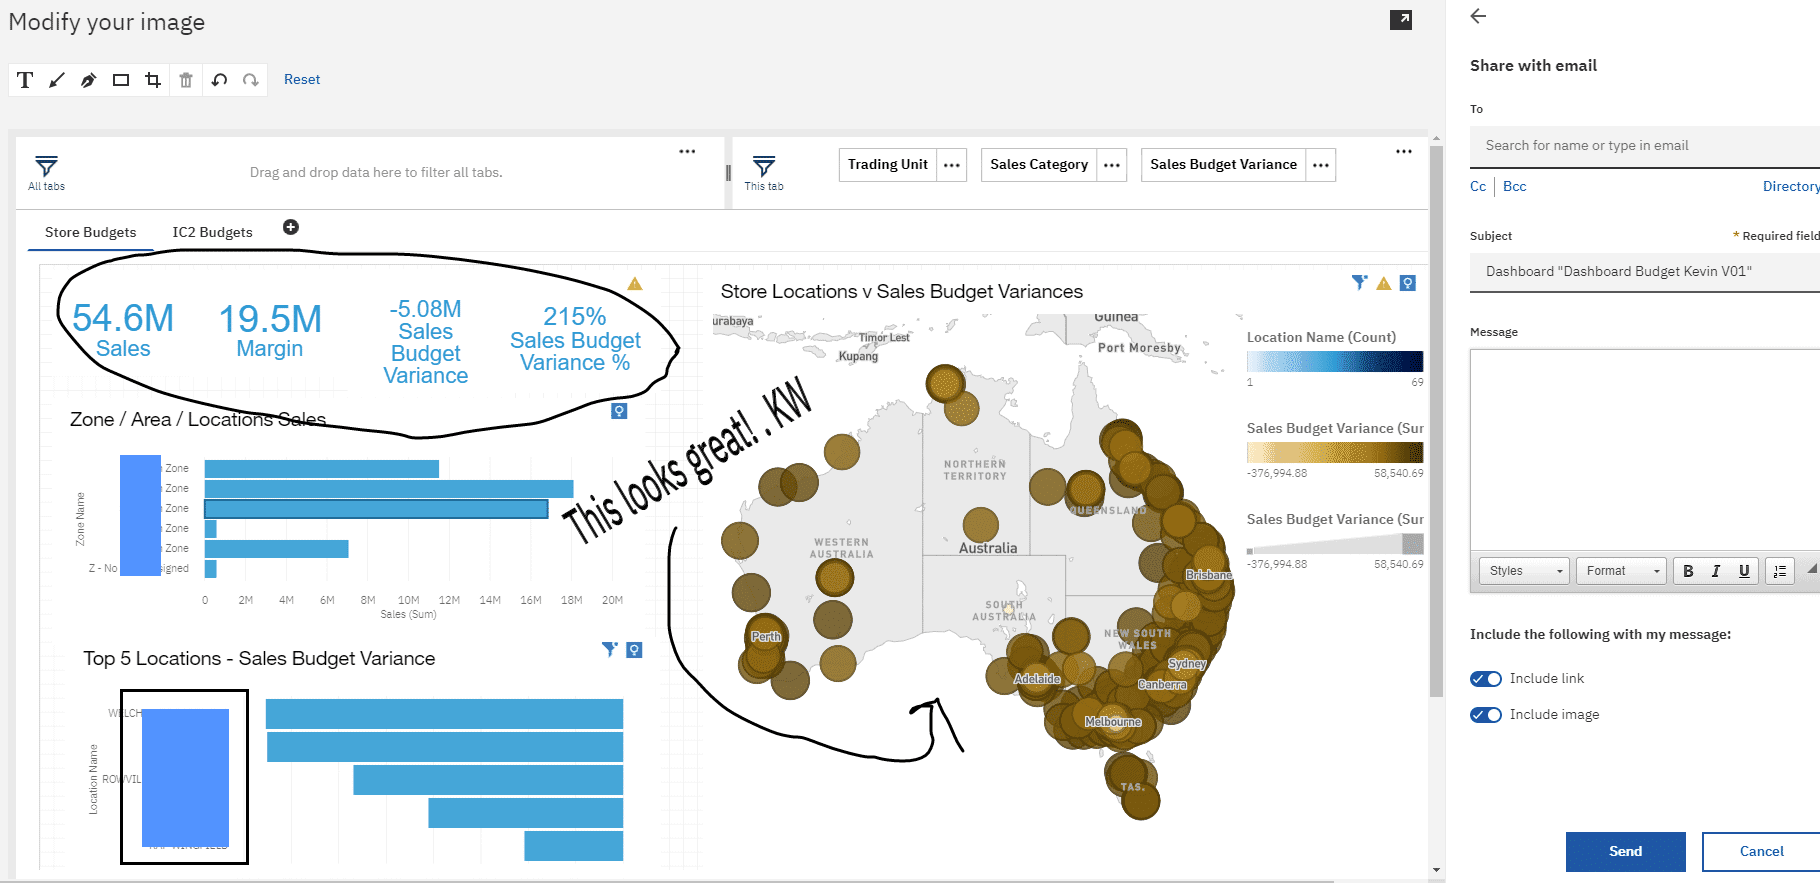
Share your content by email
One of my favourite features in this release is the ability to share your content directly within Cognos. Better yet, you can also annotate the visual before collaborating with your colleagues.
Also, the Export to PDF/Print function creates a clean output compared to previous versions. Not to mention, there are more options with the mapping of visuals.
Target for bar and column visualisations
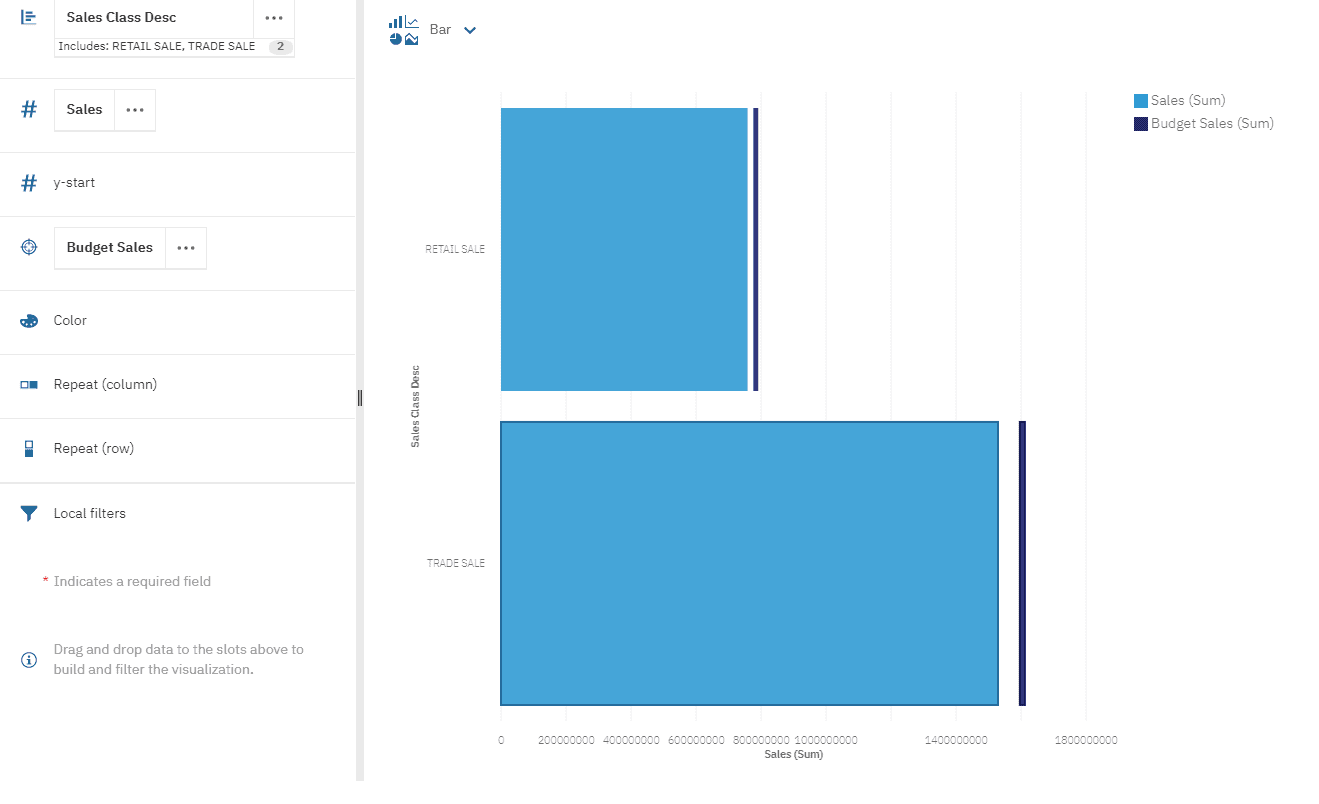
This is a very useful feature. You can use the Target data slot in bar and column visualisations in reports, dashboards, and explorations to show measures that need to be compared against a target value. It’s a simple and clean solution.
Enhanced Assistant capabilities
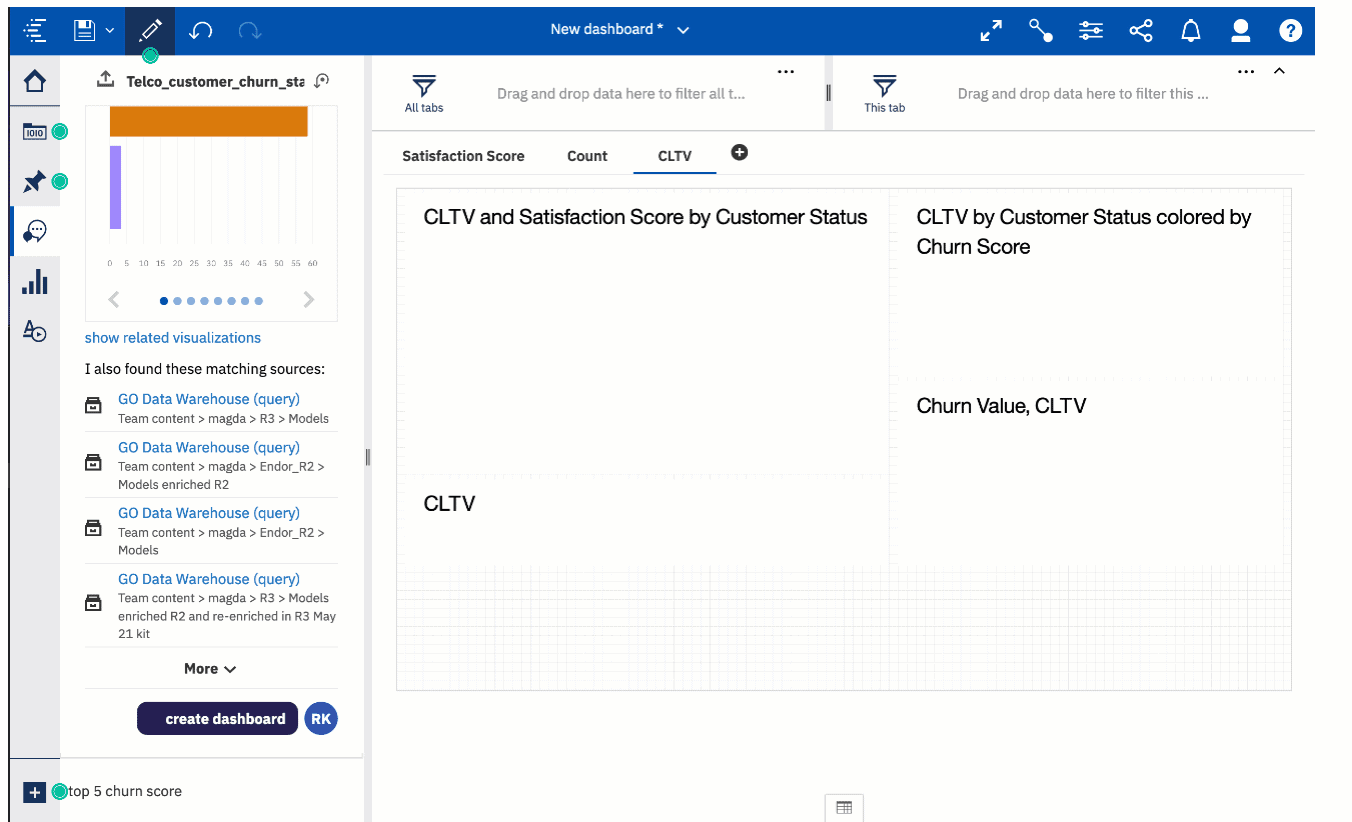
This is not the first time we have heard of NLQ (Natural Language Query; remember IBM Watson?) capabilities within Cognos. Besides offering type-ahead support to improve usability, and understanding modifiers like aggregations (eg, total, average, maximum) and filters (top/bottom), this improved AI assistant can generate a complete dashboard based on your data.
It is a perfect way to start your dashboarding journey by gradually understanding your data.
Explore only the primary relationships in your data by default
Exploration capability isn’t new but in the latest release, it continues to improve its ability to find those hidden patterns and relationships within your data.
I must admit, the exploration feature probably makes more sense to the more advanced users or those wanting to wear a data science hat. Nevertheless, it is very interesting to be able to uncover relationships between fields in your data sets.
When you start a new exploration and select a data source, the default view is the relationship diagram showing primary relationships.
The field of interest is the focal point and is represented by a dark blue circle. Related fields are organised into purple circles. Lines connect the fields and represent relationships. The thickness of the line indicates the strength of the relationship.
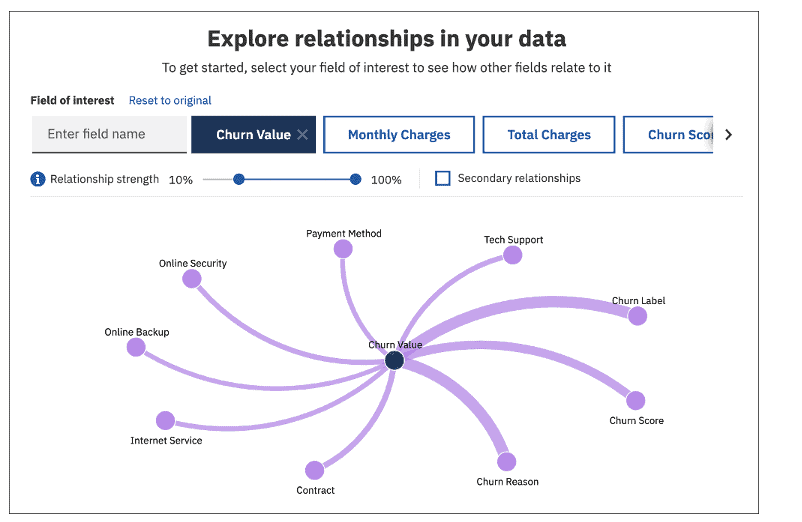
Primary relationships are the direct relationships between the field of interest and the other fields. Secondary relationships are the relationships between other fields directly or indirectly related to the target.
To view both primary relationships and secondary relationships, select the Secondary relationships checkbox.
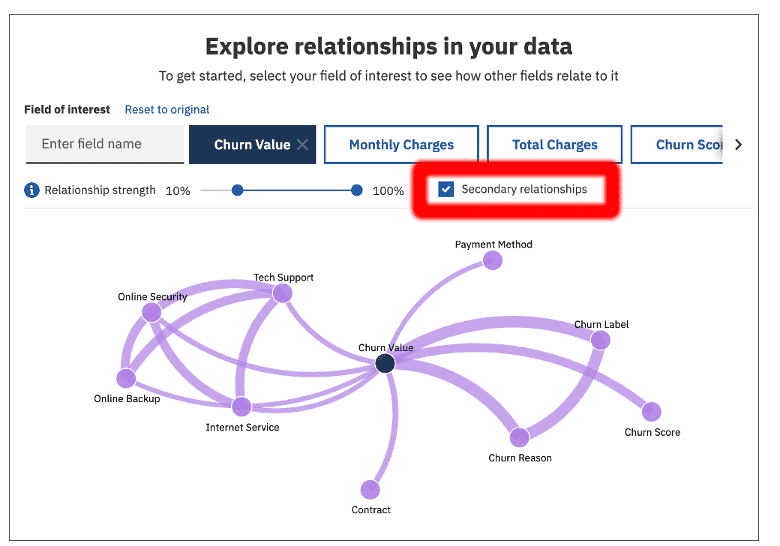
The system analyses the data and identifies interesting items. The relationship diagram plots these fields (use relationship strength slider/filter to control a range of field strengths) based on a statistical evaluation of related items.
QMetrix are certified Cognos Analytics consultants. Find out how you can unearth insights and understand your business with IBM Cognos Analytics - speak to us.
Cognos Analytics 11.0.x to 11.1.2
- 11.1.2 – What’s new, April 2019
- 11.1.1 – What’s new, November 2018
- 11.1.0 – What’s new, September 2018
- 11.1.x deprecated and removed features – June 2019
- 11.0.x new and changed features – May 2016 to September 2019
- 11.0.x deprecated and removed features – March 2016 to May 2018
Watch this video for an overview of Cognos 11.1. Its designed as an all-in-once self service analytics platform to help you unlock insights that drive smarter data-backed decisions across your organisation.
From Cognos Express to Cognos Analytics – December 2015
The following are only observations based on a short IBM presentation, not actual usage and does not cover off any architecture or administration functions.
As the product has not yet been released, any of the following functions can be changed or removed before its planned released by the end of December 2015.
During the presentation there were still a lot of “Coming Soon” sections, so December may be a very ambitious target. As you may have already realised by the name, the numbering system has been abandoned for this release and Cognos has now been rebranded to Cognos Analytics, in line with other products such as Watson Analytics and Planning Analytics under IBM.
Portal
The first thing that stands out is the new user interface, it has been completely remodeled. It has a much more modern feel with context sensitive menus that expand and collapse when required.
It makes for a more intuitive product and part of the reason behind this is that IBM wants Cognos to be used on any device, regardless of size. For those who still like the “classic” view with breadcrumbs, you can still choose to view it that way.
The welcome screen is much cleaner and comes with samples and videos to facilitate user self-learning. Search functionality is more Google-like with pre-emptive text searching.
They also switched common terminology such as “My Folders” and “Public Folders” to “My Content” and “Team Content” to encourage collaboration. Favourites and Recently Used areas have been added to the menus.
Modelling
There is an additional modelling tool which is web based. It’s seems like a light version of Framework Manager and allows for models to be created in a very short amount of time. The models can include multiple data sources and even other published Framework models.
The modelling is very basic , allowing for relationships to be created and cardinality to be set, but also things like calculations and basic string manipulation. It does not support anything such as parameter maps or macros and also doesn’t seem to be dimensionally aware.
One interesting bit of functionality it has is “pre-emptive” modelling, where the user provides the subject matter they’re about to model and it will search the data source for tables it thinks are related to the search term.
IBM indicated that they hoped to eventually move all of the Framework Manager functionality into this tool and remove the need for thick clients and model files.
Contact us to find out more about our Cognos services if you are considering upgrading your existing Cognos BI environment or just wanting to know more about Cognos Analytics.
Reporting
What about the reporting? Unlike the jump from 8 to 10, there are much bigger changes this time around. Here are a few observations:
- A shift towards self-service, user empowerment and an agile way of working.
- The ability for users to upload spreadsheets data to the content store allowing for security and auditability. The file upload process uses Watson Analytics to analyse the file and assign correct usage based on the data type. Then, as you drag data items onto the canvas Watson starts to recommend ways to display the data.
- As mentioned in the previous point, there has also been some integration of Watson Analytics, which becomes evident in the new look and feel as well as the visualisation suggestions. The longer term vision appears to be that Watson and Cognos will become much more tightly integrated.
- Static reports now become more interactive with the users able to add filters, calculations, exclusions, etc. Any changes that a users makes to these standard reports will become new content.
- Users now “subscribe” to a report rather than schedule it, and a notification will be sent to the user’s inbox area as to whether or not the subscription was successful.
- When in edit mode you can work in preview mode, i.e. data appearing in report, or design mode (so no need to constantly click that Run button when developing and testing to see your changes!)
- There are new smarts around how objects interact with each other on the canvas. If all objects come from the same query, any user applied filter will be reflected automatically in all objects.
- The use of templates and themes had been made a lot easier in order to keep a common look and feel to the reports.
- Any existing JavaScript will not work and have to be re-written (ouch!)
Are you still on the old version of Cognos? Should you upgrade to Cognos Analytics (11.1 and beyond)? Read about the changes to features and functions, and our recommendation.
Cognos Express 10.2.2 – June 2015
The latest version of IBM Cognos Express is now available and includes major changes. Cognos Express will no longer be a single product install from this release onwards and is essentially enterprise versions of Cognos TM1 and Cognos Business Intelligence products.
This means all the previous simplified Cognos Express preset configurations such as user groups and namespaces etc. has now been removed.
Enhancements
The key enhancements and features include:
- Immediate access to the latest fix packs and product updates that are available to the enterprise versions of Cognos TM1 and Cognos Business Intelligence.
- Removed the restriction of having only a single ‘CXMD’ named database. More than one TM1 server can now be added with any names, however they must be contained within the same physical server.
- Support for 64-bit versions of the Microsoft Excel Client up to 2013.
- Ability to use IBM Cognos Analysis for Microsoft Excel (CAFE).
- Ability to connect to Cognos BI Framework Models within TM1 using the TM1 Package Connector.
- Ability to setup encrypted connectivity between the client and server via SSL.
- Cognos Express Manager replaced by the enterprise administration functionality of Cognos TM1 and Cognos Business Intelligence.
- Cognos TM1 and Cognos BI can now be split up and installed on separate servers.
- Ability to host the Cognos Content Store database on different platforms such as MS SQL Server.
Differences between Cognos Express and Enterprise
In terms of features and functionality, the differences between Cognos Express and its big brothers – enterprise Cognos BI and TM1 are much smaller. Core functionality within Cognos Express still exists, but there are some exclusions:
Cognos BI
- Dynamic Cubes
- IBM Cognos Analysis Studio
- IBM Cognos Query Studio
- IBM Cognos Real-time Monitoring
TM1
- SAP BW connectivity via the package connector
IBM Cognos Express is now more powerful than ever for small or medium organisations that require less than 100 users.
Cognos Express 10.2.1 – November 2013
IBM have recently released the latest version of their midsized and SME targeted business intelligence and performance management platform Cognos Express 10.2.1. This release brings the integrated platform in line with its enterprise big brothers Cognos BI 10.2.1 and TM1 10.2.
Some of the new features of this release include:
- Multi-threading capability for TM1 (yay!)
- Improved support for IBM Cognos Mobile
- IBM Cognos Microsoft Office add-in
- Cognos TM1 Mobile Contributor app
- Improved Performance Modeller
- Supports for Microsoft Analysis Services (MSAS) data sources
- Cognos TM1 Scorecarding
- Inclusion of TM1RunTI is a command line interface tool that can initiate a
- TM1 TurboIntegrator (TI) process from a command line
- Inclusion of TM1 Operations Console
- Support for Microsoft Windows 8 and Microsoft Windows 2012
As always, under the hood there has also been a number of updates and bug fixes applied.
Looking to leverage the best of Cognos Analytics? QMetrix are certified IBM Cognos Analytics consultants who have partnered with clients across industries. We provide end-to-end solutions from analysis to design and delivery. Talk to us about how to make Cognos work for your business


