A question we often get asked is: “Why do we need Workday Adaptive Planning if we already use Power BI”? Put simply, it depends on what you are trying to achieve.
While both tools are powerful, they serve different purposes in an organisational setting. A good analogy is to think about driving a car – with Workday Adaptive Planning you are looking through the windscreen, whereas with Power BI you are looking in the rear-view mirror.
One solution therefore is forward looking: what is likely to happen and how will we navigate this? And one is backward looking: where have we been and what has happened? Now this is a simple explanation that broadly helps to distinguish the two, but it warrants a deeper discussion.
Key differences between Workday Adaptive Planning and Power BI
Workday Adaptive Planning is integrated financial planning and analysis software. It also sometimes referred to as Corporate Performance Management or Enterprise Performance Management software. It is best suited to corporate planning activities, including undertaking forecasts, budgeting, and scenario analysis in a collaborative and efficient way. Data entry or input by users is a key aspect of these types of solutions. The time horizon can extend beyond the current year, thus supporting longer term and strategic planning.
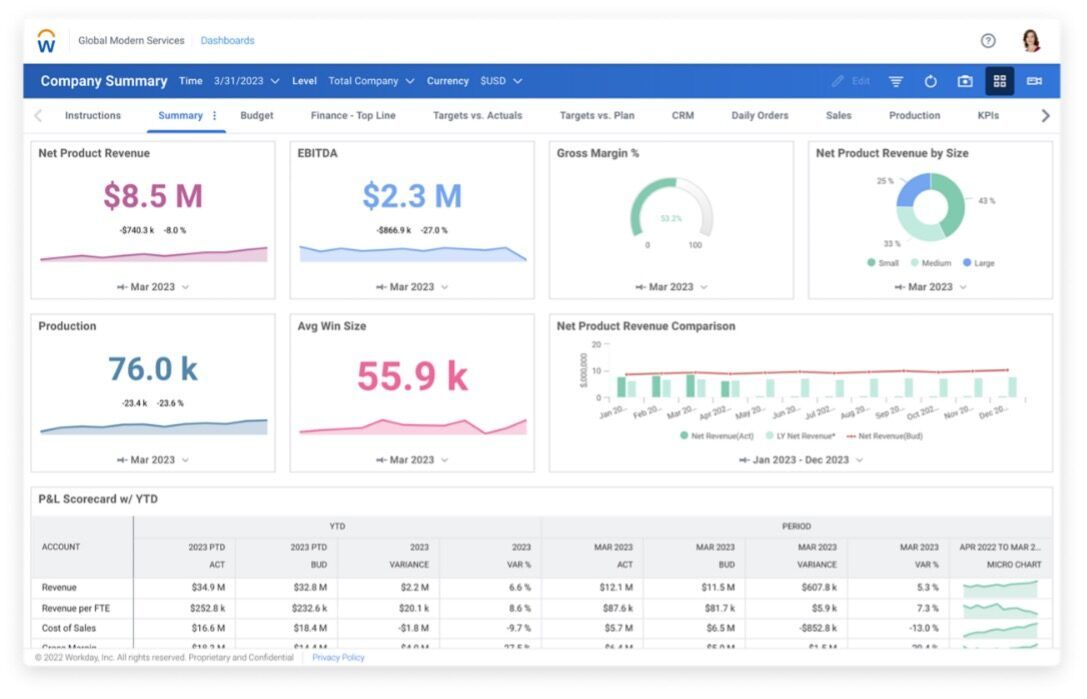
It also supports reporting and dashboarding, typically focussed on the office of finance obligations in measuring and reporting on corporate performance – comparing actual results against plans, often with a profit and loss focus.
On the other hand, Power BI is best described as business intelligence software or reporting and analytics software.
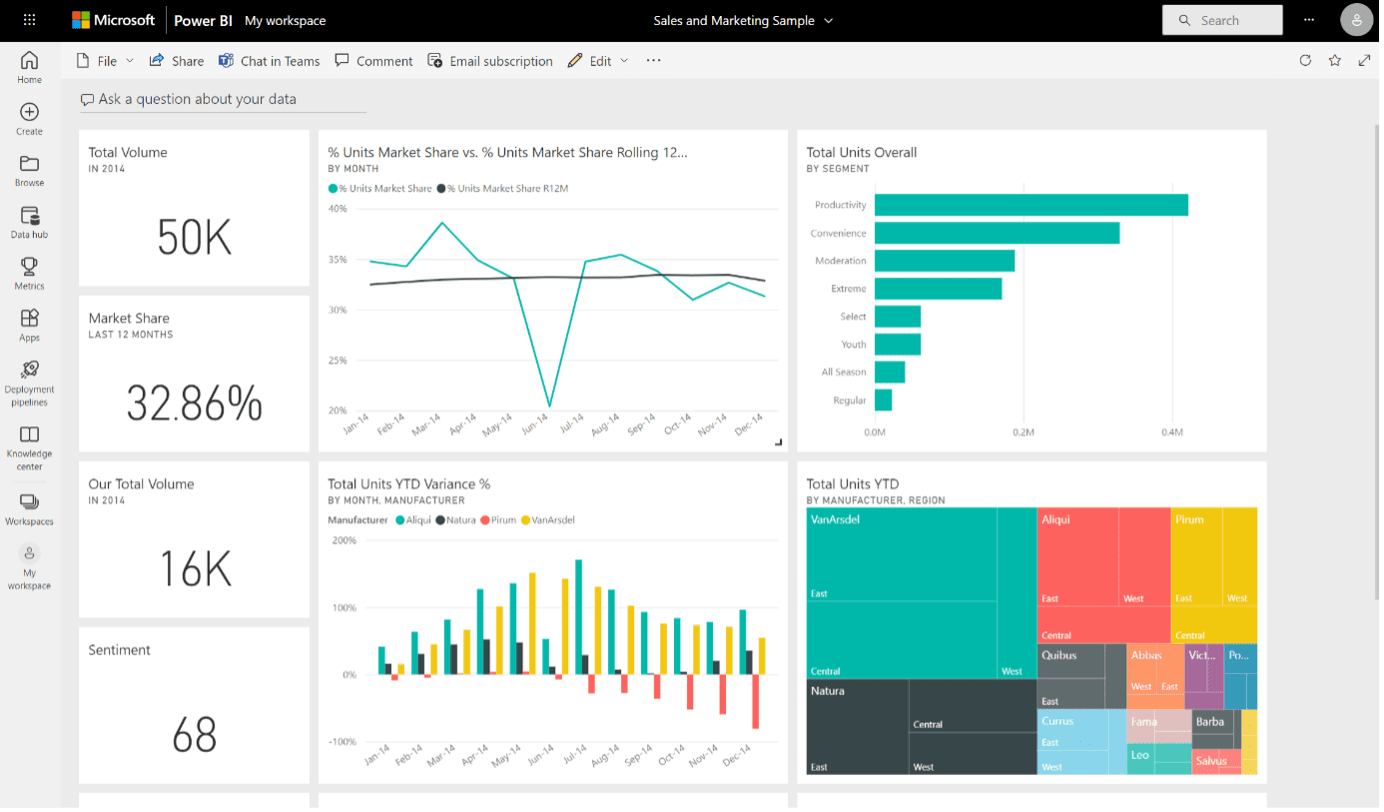
Its typical use cases are for operational reporting, sometimes in real time, though its strength is in its extensive visualisation capability that offers dynamic insights into day-to-day business performance.
Power BI reports may or may not include plan data, such as budgets or forecasts, with the emphasis on reading or loading historical data sets, but perhaps at a far more granular or operational level than you might see in Workday Adaptive Planning
Due to their differing applications within the organisation, Workday Adaptive Planning is usually owned and managed by the internal finance team, whereas Power BI is typically owned and managed by the IT team or data and analytics team.
Both tools are well equipped to provide self service capability to end business users so they can build their own reports from pre-loaded data sets.

As mentioned above, one of Workday Adaptive Planning’s key strengths is to budget, forecast and run scenarios. This enables the finance team to plan performance (through projected profit and loss, balance sheet and cashflow), and where appropriate, allowing the wider business to be involved in the process. This includes having driver-based models that incorporate both financial and non-financial values and assumptions for users to input.
Whilst Power BI is not suited to the use case outlined above, it is important to note that both solutions do have a predictive forecasting capability. That is, identifying patterns and trends in historical data to predict future outcomes – which may assist aspects of the corporate planning process, such as using historical sales to derive a future sales plan. Power BI may also play a role in providing data for the finance team to undertake aspects of the planning process (e.g, providing baseline sales data by relevant dimension). However, this may still lead to significant manual effort and lack of integrity during the planning activity.
Now that we’ve explained some of the key difference in the broader use case of Workday Adaptive Planning over Power BI, we have also noted a significant crossover in use cases relating to reporting. Now might be an ideal time to take a deeper dive into the reporting capabilities of each and their typical applications.
Reporting Use Cases for Workday Adaptive Planning
Workday Adaptive Planning is designed to handle structured financial and management reporting as a core capability. This includes things like profit and loss, balance sheet and cashflow reports, monthly departmental variance reports and even Board packs. That is not to say Power BI cannot do these things – it is just a lot harder and requires far more configuration effort to get the desired result, and something that is well beyond the capability of the average finance person’s skillset to build in Power BI.
Workday Adaptive Planning’s core data source is the general ledger, but commonly extends to other systems such as payroll / HR, CRM or other systems depending on need.
As well as handling core finance and management reporting obligations, Workday Adaptive Planning also extends to the following:
- Board Reports: Through Workday Adaptive Planning’s OfficeConnect capability, it seamless integrates with Microsoft Excel, Word and Powerpoint or Google Sheets and provides an efficient way of collating and updating various datasets and reports into a consolidated board pack.
- Reporting via alternate reporting hierarchies and structures: Alternate hierarchies can be created and managed easily within the solution by using attributes to tag different levels or elements within the hierarchy. While this allows users to view and analyse data from multiple perspectives, it can be particularly useful for preparing things like statutory reports which can be a real pain for finance people.
- Reporting to Compare and Contrast Scenarios: As Workday Adaptive Planning holds unlimited planning versions, you can compare multiple scenarios, forecasts or budgets, helping you evaluate different projections and impacts of various assumptions quickly and effectively through tabular reports or charts and visualisations. Power BI is likely to only contain the final approved budget or forecast, rather than all existing “live” scenarios, budget and forecast versions, thus making this sort of analysis on the fly very difficult.
- Detailed Variance Analysis: Workday Adaptive Planning often holds granular plan data within the driver-based planning models that underpin the budget or forecast. It can therefore be very effective for detailed variance analysis when actual data sets are loaded at the same granularity. A laser focus can be applied where variances between plans and actual results exist, and explanations and/or remedial action can be quickly determined.
- Multidimensional reports: Reports in Workday Adaptive Planning, like Power BI, can be multi-dimensional, allowing you to filter and analyse the organisational performance from various perspectives. Therefore, use cases for reporting in Workday Adaptive Planning can extend beyond office of finance requirements and can include, for example, sales and payroll/headcount reporting.
Reporting Use Cases for Power BI
Now let’s turn our attention to the reporting use cases of Power BI. As mentioned earlier, it is best described as business intelligence software or reporting and analytics software. As a Microsoft solution, it is ubiquitous and typically has a wider footprint in the organisation.
As its primary purpose is for data visualisation, it offers a wide range of interactive visuals, with the ability to drill down and apply filters, making it easier to undertake analysis of complex datasets. It does offer rich customisation options which, relative to Workday Adaptive Planning, represents a more powerful capability, should it be required.
The types of data sources ingested by Power BI are typically more diverse than you would see with Workday Adaptive Planning, due to the more operational and day to day use cases for the solution. Commonly cited examples where Power BI is leveraged include sales analysis, customer analytics, inventory optimisation, supply chain logistics and marketing campaign performance.
Therefore, reporting use cases where Power BI may be a preferred option are as follows:
- Operational Daily/Weekly reports: Power BI is great for creating dashboards and reports that provide up-to-the-minute information on operational metrics.
- Interactive visualisation: Power BI offers a dynamic, interactive way to explore data, through the deployment of highly bespoke dashboards.
- Real time insights: Power BI’s real-time monitoring feature can be of benefit where operations require up-to-the-minute visibility on performance.
Power BI also has seamless integration with the Microsoft ecosystem, including Azure and SharePoint, so this may be seen as an advantage in some organisational settings.
Irrespective of the end user tool in place, to get the best out of solutions such as Power BI, organisations must ensure good quality data is fed into them. This can be difficult when attempting to integrate complex datasets across multiple systems in a meaningful way, and this often requires additional skills and capabilities devoted to building a data platform.
Can Workday Adaptive Planning and Power BI work together?
With a puristic mindset one might prefer a single technology to satisfy the reporting and analytical needs of an organisation. While this is understandable, it is not always the most pragmatic option. When it comes down to it, both Workday Adaptive Planning and Power BI are excellent tools and despite the cross-over in reporting and analytics capability, they ultimately serve different purposes and use cases.
In our experience, many clients have Workday Adaptive Planning and Power BI working happily side by side, with Workday Adaptive Planning doing the heavy lifting for planning and office of finance reporting, and Power BI doing the heavy lifting for broader operational reporting. Often, this occurs when Power BI is already a mature, embedded solution within the organisation, and at a later stage, Workday Adaptive Planning is procured to drive a more effective financial planning and analysis function.
These tools don’t compete; instead, they complement each other.

Let’s explore examples in more detail:
- Financial reporting meets business intelligence: After finance teams use Workday Adaptive Planning to build out their financial budgets and forecasts, Power BI can be used to integrate the approved plan with actual data sets for consumption through interactive dashboards shared across the organisation.
- Bridging strategy and execution: Workday Adaptive Planning lays out the financial roadmap aligned to the corporate strategy and helps you analyse various scenarios through the lens of key performance Indicators (KPIs). Power BI helps you monitor the execution of the strategy by monitoring the company’s day-to-day performance in line with such KPIs and if necessary, in real time.
- Better departmental collaboration and visibility: Workday Adaptive Planning enables sales managers to collaborate effectively to build out detailed sales forecasts. The performance against forecasts are delivered through Power BI dashboards across the entire sales team, with everyone receiving reports and visualisations in a format that makes sense to them.
- Driving efficiency: Workday Adaptive Planning acts as a data source for Power BI, with various integration options available to ensure efficient data flow and synchronised systems. This removes the challenges which typically occur having to align planning data sets (Excel or similar) with line of business systems (actual data) on a regular basis.
I hope this clears up any confusion about the application and use cases of Workday Adaptive Planning and Power BI. And if you’re in doubt, drop me a message and we can chat about it.Here’s a short video which explains broadly how Financial Planning and Analysis tools (such as Workday Adaptive Planning) and Reporting and Analytics tools (such as Power BI) compare on a very high level:
DOWNLOAD fact sheet
Workday Adaptive Planning vs Power BI Fact Sheet
To compare the differences between Workday Adaptive Planning versus Power BI, download this fact sheet with a comparison table and use cases.
